
Coursework figure
Import a lab CSV, create named variables, build an X&Y card, set log axes if the data needs them, annotate, and export the figure.
Import, name the variables that matter, fit, annotate, and export a PNG or JPEG at journal DPI. The Free tier covers it - and the project reopens for edits when your supervisor has notes. Vector PDF comes with Plus, free for your first 30 days.


Apple silicon · macOS 15 or later · Free plan · Plus free for 30 days
Send to my MacAutoplot runs on a Mac. Send the link to yourself, or open it in the Mac App Store.
In practice
Import a messy lab CSV, name the variables that matter, and build an X&Y plot or a fitted histogram - without rebuilding the pipeline every time you reopen it.
PNG and JPEG export at journal DPI is in the Free tier, and Plus, free for your first 30 days, adds vector PDF with embedded fonts, so the first submission-ready figure is never behind a checkout.
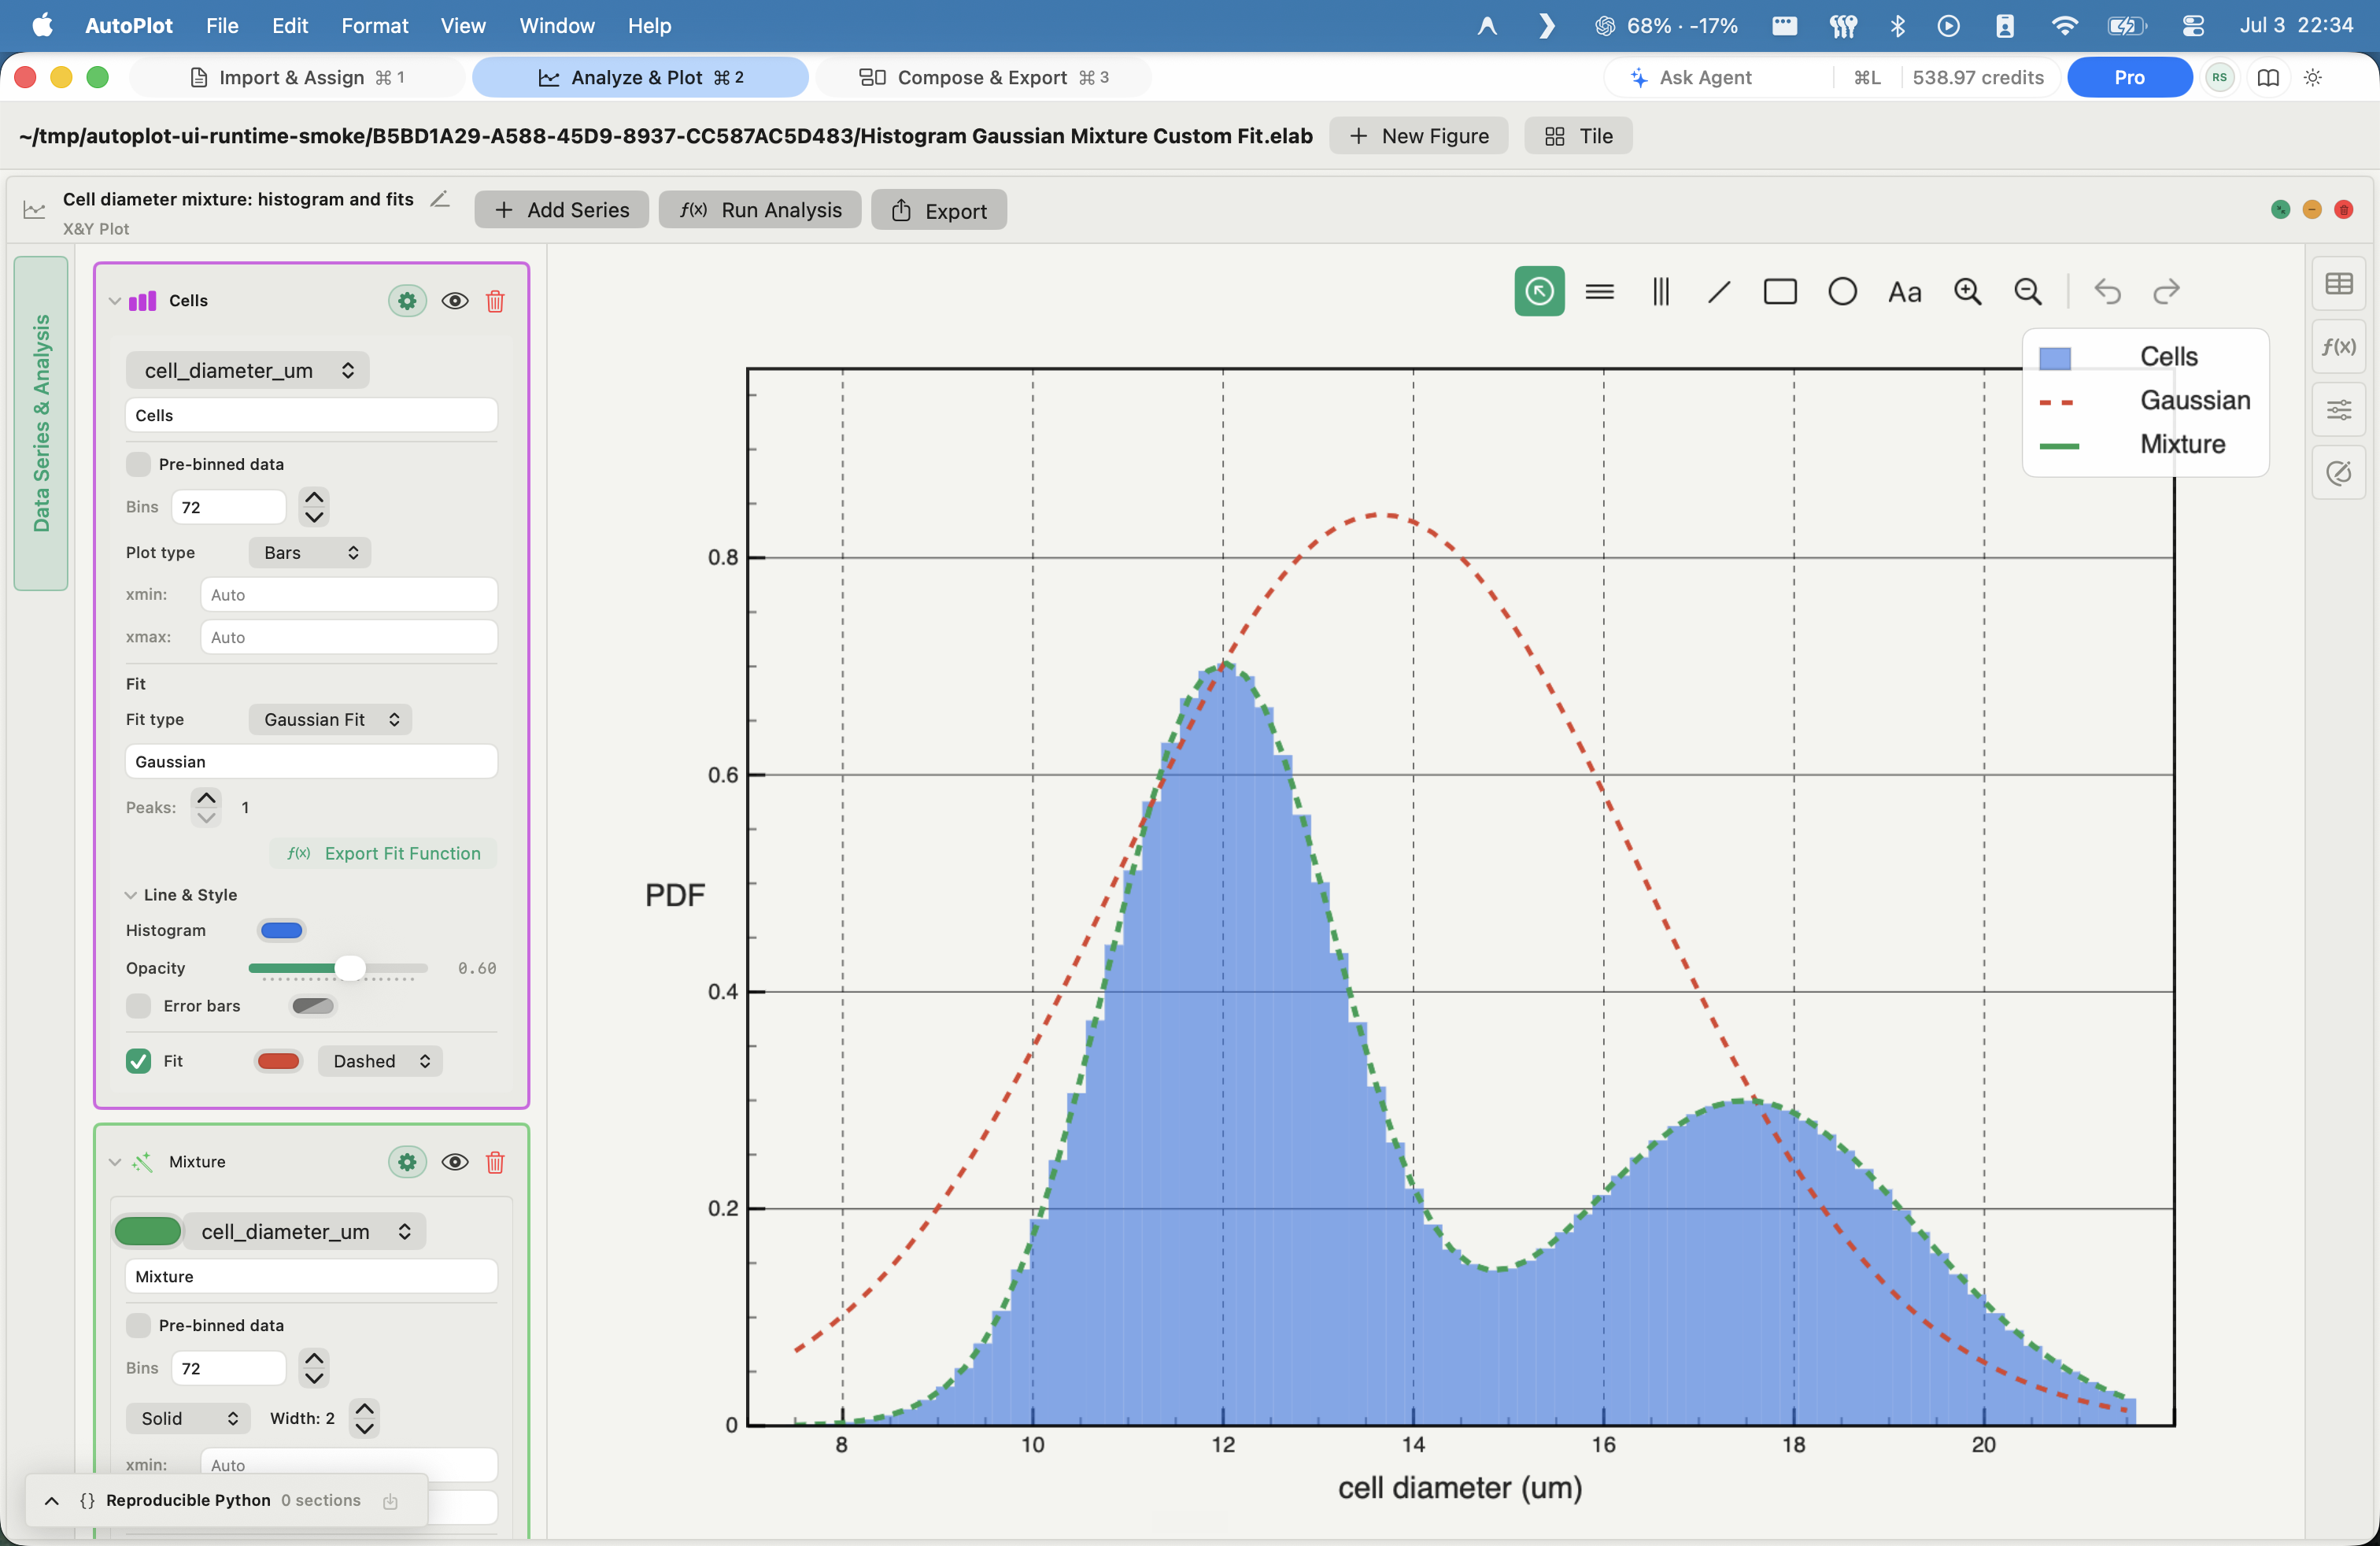
Three ways in
Import a lab CSV, create named variables, build an X&Y card, set log axes if the data needs them, annotate, and export the figure.
Save the project, reopen it weeks later, adjust the card, and export again - without hunting for the notebook cell that made the old plot.
Get the analysis shape right in the app, then read the Python execution trace - the exact code Autoplot ran - when you want to understand or modify the pipeline.
FAQ
Yes - and that is the point. It matters to understand the first principles of the analysis, not just the figure that comes out.
Autoplot is not a replacement for learning Python; it is a replacement for losing an afternoon to library documentation when the real task is a deadline figure. Every operation the assistant runs leaves a Python execution trace you can open, read, and copy - so you can study the exact code that produced your result.
Usually, yes. Free is permanent - not a trial - and covers:
Plus opens the heavier surfaces - CCDF, scaling, heat maps, correlations, vector PDF - if your work grows into them.
Yes. Free exports PNG and JPEG at journal DPI; Plus and Pro add vector PDF with embedded fonts. Annotations live with the figure and move when you restyle, so the version you hand in matches the one you tuned.
Yes. A project file preserves your imported files, variables, cards, annotations, and chart appearance. Reopen it, adjust a card, and re-export - you are editing the analysis, not reconstructing it from memory.
Pricing is uniform at launch, with no academic discount yet - but a student discount is coming soon. In the meantime, Free is permanent and covers what most coursework needs.
The app follows the steps you would take anyway: import, name variables, build a card, fit, annotate, export. When you are unsure how to express an analysis, describe it to the assistant in plain language - it proposes a structured operation and waits for you to confirm before anything runs.
CSV, TSV, and text files, with a parsing preview before you commit. Inspect delimiters, headers, and skipped rows, then promote columns to named variables.
Log-binned distributions, CCDF tail fits, x_min diagnostics, FSS, and scaling relations (x ∼ yᵅ) are first-class tools, not notebooks to reassemble - and every result carries the exact Python that produced it.
Apple silicon · macOS 15 or later · Free plan · Plus free for 30 days
Send to my MacAutoplot runs on a Mac. Send the link to yourself, or open it in the Mac App Store.
In the workspace
Log-binned distributions, power-law fits, CCDF tail fits from the powerlaw library, x_min selection by KS distance, scaling relations (x ∼ yᵅ), heat maps, and correlation matrices - built in, not assembled by hand from a Python package each time.
Project files preserve variables, cards, workspaces, annotations, and appearance, so a result you found last month reopens exactly as you left it.
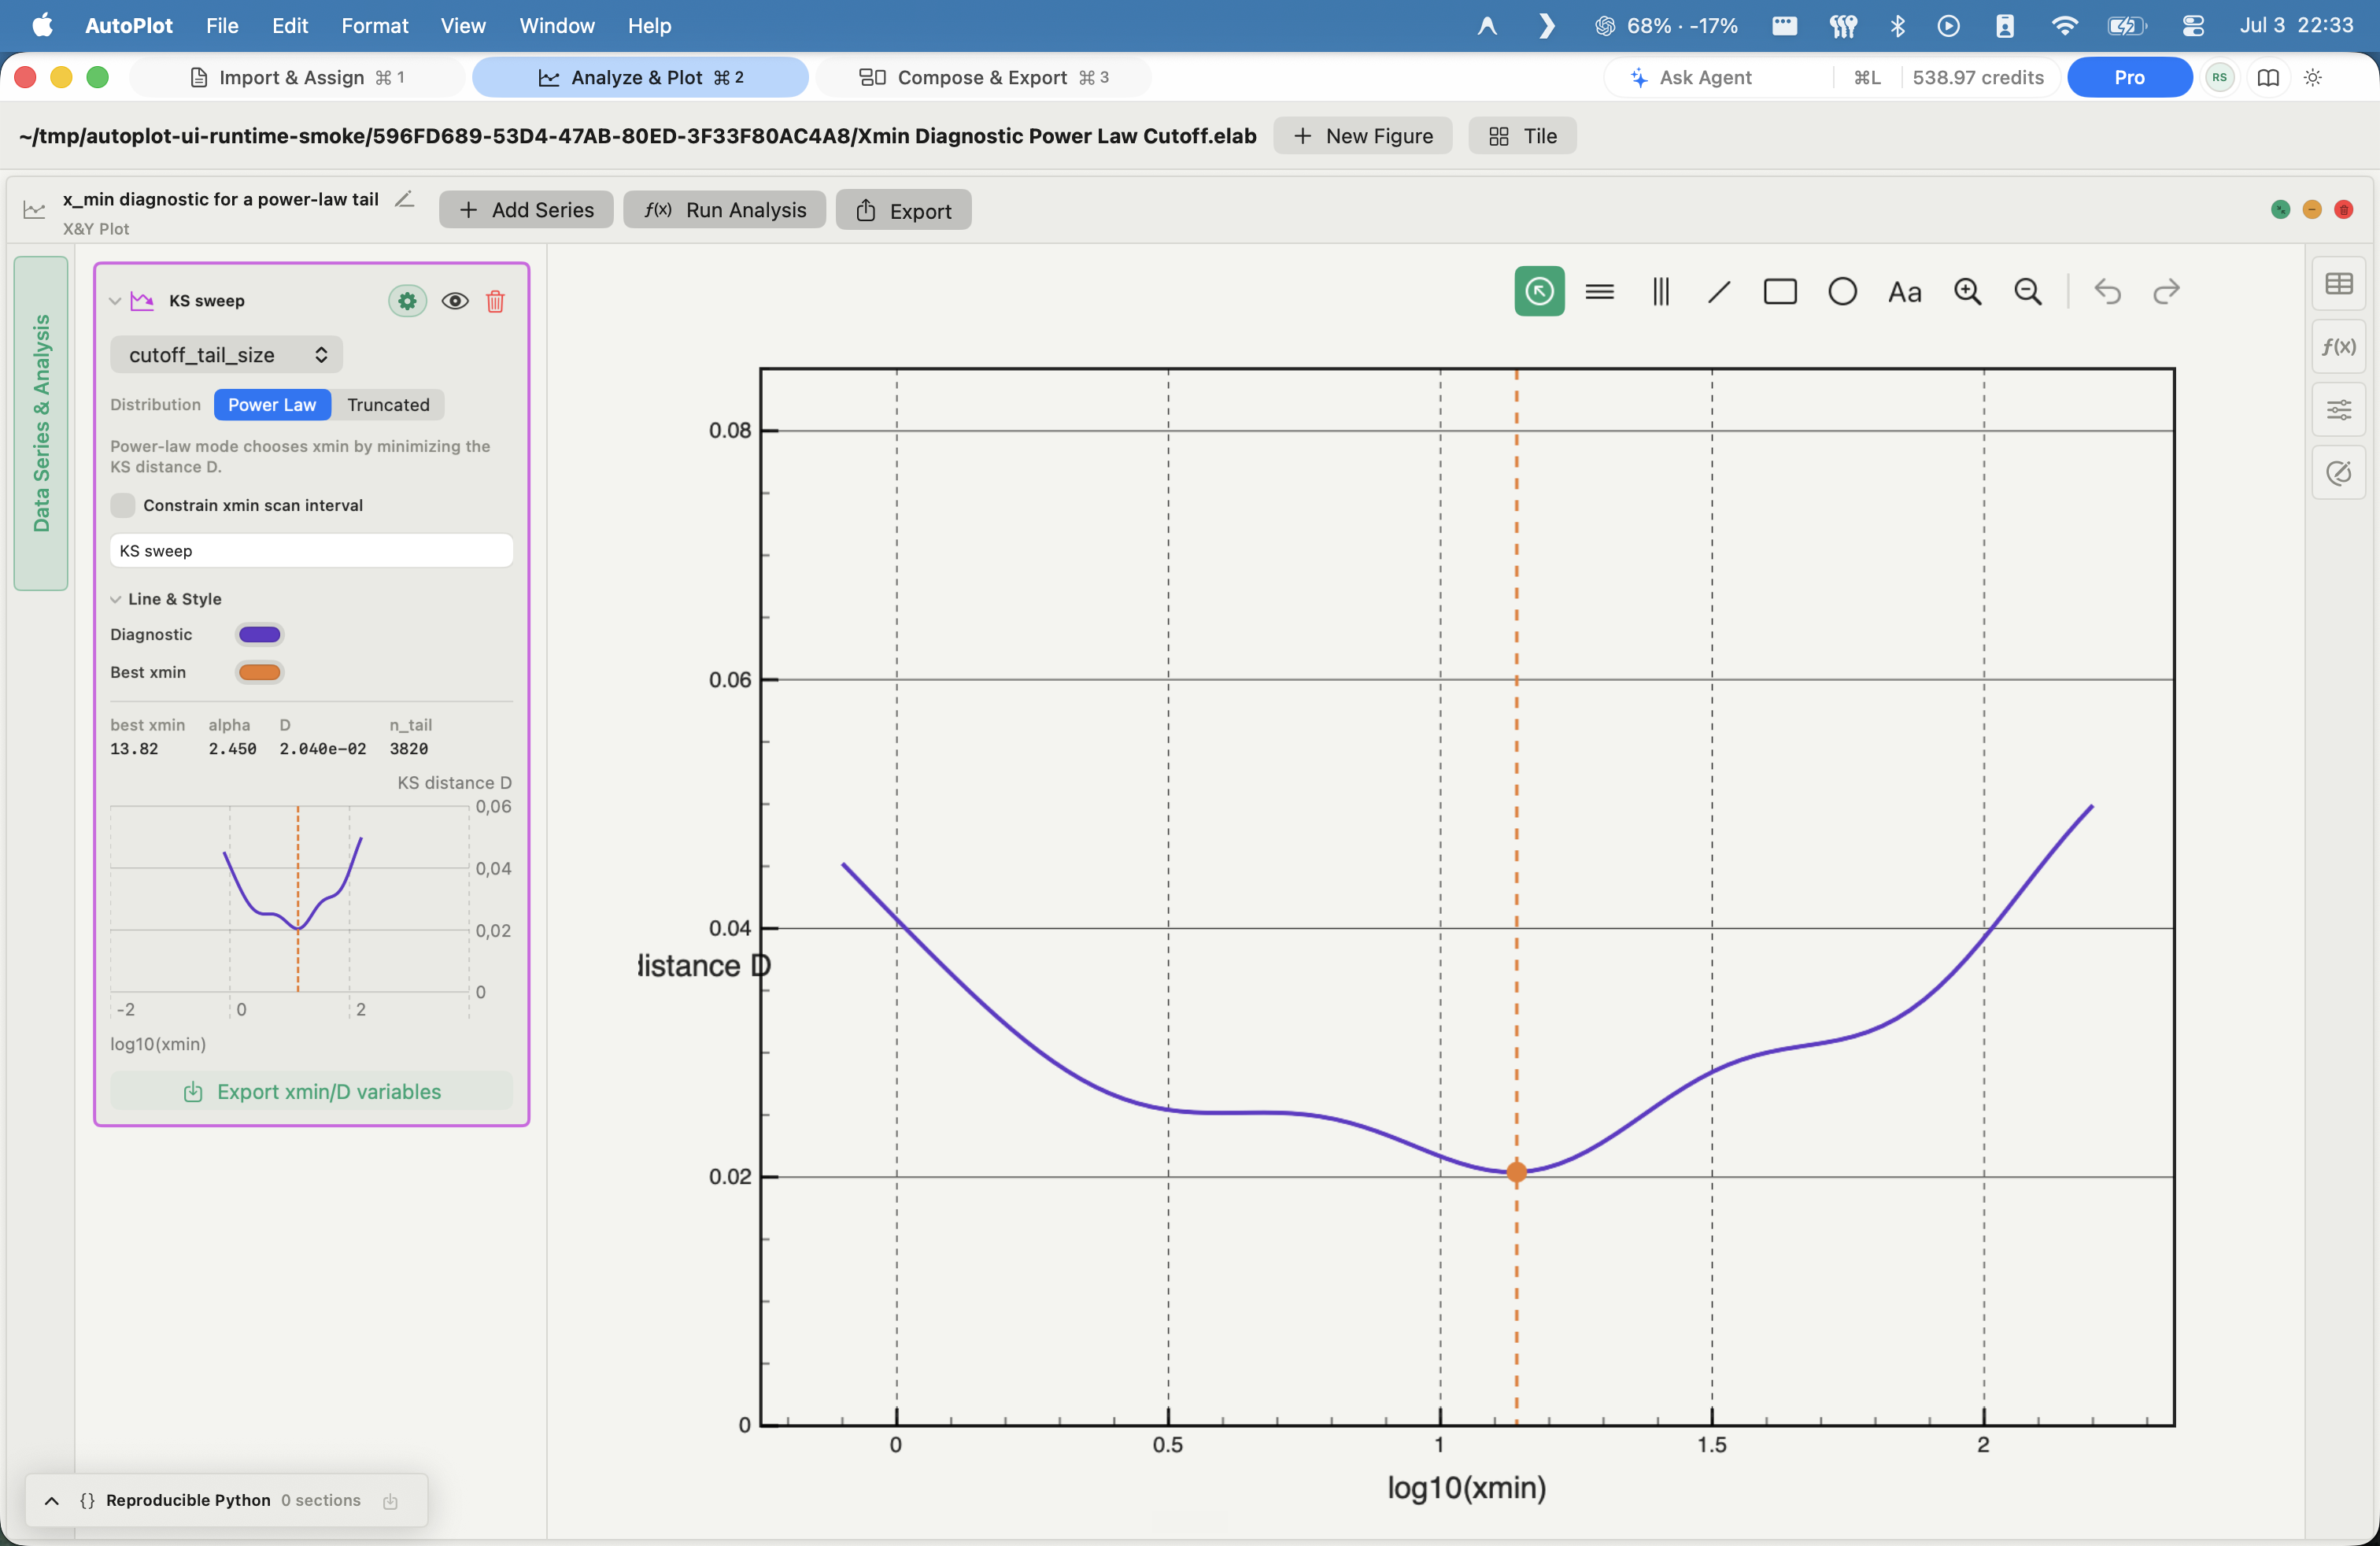
Three workflows
Build X&Y and CCDF cards, inspect tails on log axes, add Xmin diagnostics, compare candidate fits, and export the figure - or copy the Python the assistant generated.
Move from selected variables into correlation matrices or heat maps when the problem is inherently 2D or many-variable, without flattening it into one generic chart.
Use Compose to assemble X&Y, histogram, CCDF, heat-map, scaling-relation, chart, and correlation sources into paper-backed multi-panel boards, exported as a single figure.
FAQ
Yes, in two practical ways:
Free covers the core; Plus opens the advanced surfaces.
Transparently. The log-space PDF fit is a least-squares slope on the log-binned distribution - deliberately simple, and stated as such rather than dressed up as a maximum-likelihood estimate. The CCDF tail fit uses the Python powerlaw library, and a separate x_min diagnostic scans candidate cutoffs by Kolmogorov-Smirnov distance.
It is the analysis you would otherwise assemble from the powerlaw package and Matplotlib - here it is a card that stays part of the saved project, with the generated Python available to inspect.
Your intent and your dataset's schema - column names, types, and sizes - never the raw values. It proposes a structured operation; nothing mutates the project until you confirm. The operation then runs locally and leaves a Python execution trace, so you can see exactly what produced the result. Data privacy
Open-weights models from a curated set, served through a hosted infrastructure provider chosen for your data privacy. The app's model selector shows what is currently available. It is a narrow analysis assistant gated behind your confirmation, not a frontier chatbot you paste data into.
WaveMetrics' Igor Pro 10 is Windows-only. Igor Pro 9.05 is the last Mac release, and on Apple silicon it runs only through Rosetta.
Autoplot is honestly not at feature parity - Igor's macro language and waveform model have no like-for-like replacement here. What it is: a native Mac scientific workstation built around modern fitting, plotting, reproducibility, and a conversational assistant Igor does not have. CSV and text imports work today; .ibw and .pxp import remain roadmap items.
Native SwiftUI for Apple Silicon, with document-based projects that open and save like any Mac file. Numerical work runs through a persistent in-app Python engine - NumPy, SciPy, Matplotlib, and the surrounding local toolkit - so the stack underneath is the one you already trust.
Most working scientists will.
The local toolkit - import, variables, fits, plots, Compose, export - runs entirely on the Mac. Nothing remote touches the data unless you opt in to the assistant, which reads intent and schema, never raw values.
Apple silicon · macOS 15 or later · Free plan · Plus free for 30 days
Send to my MacAutoplot runs on a Mac. Send the link to yourself, or open it in the Mac App Store.
Local-first
The local toolkit - import, variables, workspaces, fits, plots, Compose, and export - runs entirely on the Mac. By default, nothing remote touches the data.
The hosted assistant is opt-in and account-based; turning it off removes no part of the non-AI feature set.
SwiftUI shell
Persistent Python engine
Local project documents
Apple Silicon focus
Three situations
Analyze tabular results without uploading files to a shared dashboard or an external AI workspace. The boundary is a single, explainable line.
Use a native Mac app rather than a per-seat BI platform when the job is scientific plotting - an experiment, a curve, a figure - not a dashboard rollout.
Intent plus schema may leave for the hosted assistant; raw values stay local, behind a confirmation gate. Simple enough to put in front of compliance.
FAQ
Yes - and by default the answer is reassuring. The local toolkit imports, transforms, fits, plots, and exports entirely on the machine; nothing remote touches the data unless you turn on the hosted assistant.
If hosted AI is off-limits in your environment, disable it and the workstation stays fully useful. The boundary is one explainable line, not a diagram nobody can follow.
Your intent and the dataset's schema - column names, types, and sizes - never the raw values. The assistant proposes a structured operation that waits behind a confirmation gate; once you approve it, it runs locally and leaves a Python execution trace you can inspect.
Yes. The non-AI toolkit works without a network connection. Only the optional hosted assistant, account, and billing paths reach out, and disabling the assistant costs you no local features.
No. Raw values never reach the AI layer, and the open-weights model behind the assistant does not train on inputs. There is no cloud workspace accumulating your experiments.
No. Project files are local and portable, so the analysis is never held hostage in a vendor's cloud. Autoplot is a tool you run, not a platform you rent a seat on.
Yes. The hosted assistant on Apple Private Cloud Compute is upcoming, for on-device-grade privacy without giving up the conversational layer.
It is not a business-intelligence tool, not a notebook environment, and not a general chat AI. It is a native Mac workstation for scientific plotting and analysis. If the job is a dashboard rollout or an enterprise ML platform, this is the wrong tool - and we would rather say so.
Download it directly or from the Mac App Store and assess the local toolkit and the Plus feature set without any cloud onboarding. The data path needs no review unless you choose to enable the hosted assistant.
Download the Mac build and start with the first honest changelog.
Apple silicon · macOS 15 or later · Free plan · Plus free for 30 days
Send to my MacAutoplot runs on a Mac. Send the link to yourself, or open it in the Mac App Store.