
On this page
Merge or compare: decide before you import
"Plot these files together" can mean three different operations. Picking the wrong one is the usual source of a plausible-looking but wrong figure.
| Goal | How to combine | What to watch |
|---|---|---|
| Pool observations split across files | Stack rows, matching columns by name | Add a source column first, or the runs become indistinguishable |
| Compare runs or conditions | One series per file on shared axes or panels | Same units, same X definition, consistent colours |
| Join different measurements of the same samples | Join on a key such as sample ID or timestamp | Row order differs between files; position is not a key |
A fourth case is common too: reduce each file to a few numbers (a peak, a mean, a fitted slope) and plot those against the run parameter. That is a per-file summary table, and it is often the figure the paper actually needs. If the number is a fitted parameter, the guide on how to fit a curve to data covers what to report with it.
Check that every file parses the same way
A batch is only as consistent as its least consistent file. Before combining anything, check each file, or at least the first, last and any from a different instrument or date:
- the same delimiter, header row and number of preamble lines;
- the same column names, in the same units, with the same decimal convention;
- the same meaning for empty cells,
NAand zero; - comparable sampling: the same time base or X grid when rows will be compared directly.
Two files can share column names and still record different units or sampling intervals. Check the structure, not the filenames. The single-file checks are in the guide on how to plot CSV data on a Mac.
Merge CSV files for plotting without losing the source
Stacking, or concatenation, appends the rows of each file below the previous one and lines up columns by name. Columns that exist in only some files are filled with empty values elsewhere. A column renamed between files, Temp in one and temperature in another, becomes two half-empty columns rather than one.
Stacking also discards the one fact you most need later: which file a row came from. Add a column such as run or source_file to each file before the merge, or make sure your tool adds one. Without it, you cannot colour by run, exclude a bad run, or check whether an outlier comes from one file.
For joins, use an explicit key. Two instrument logs exported at the same time can still differ by a dropped sample, and position-based alignment then shifts every later row silently.
Compare runs on one plot, or in panels
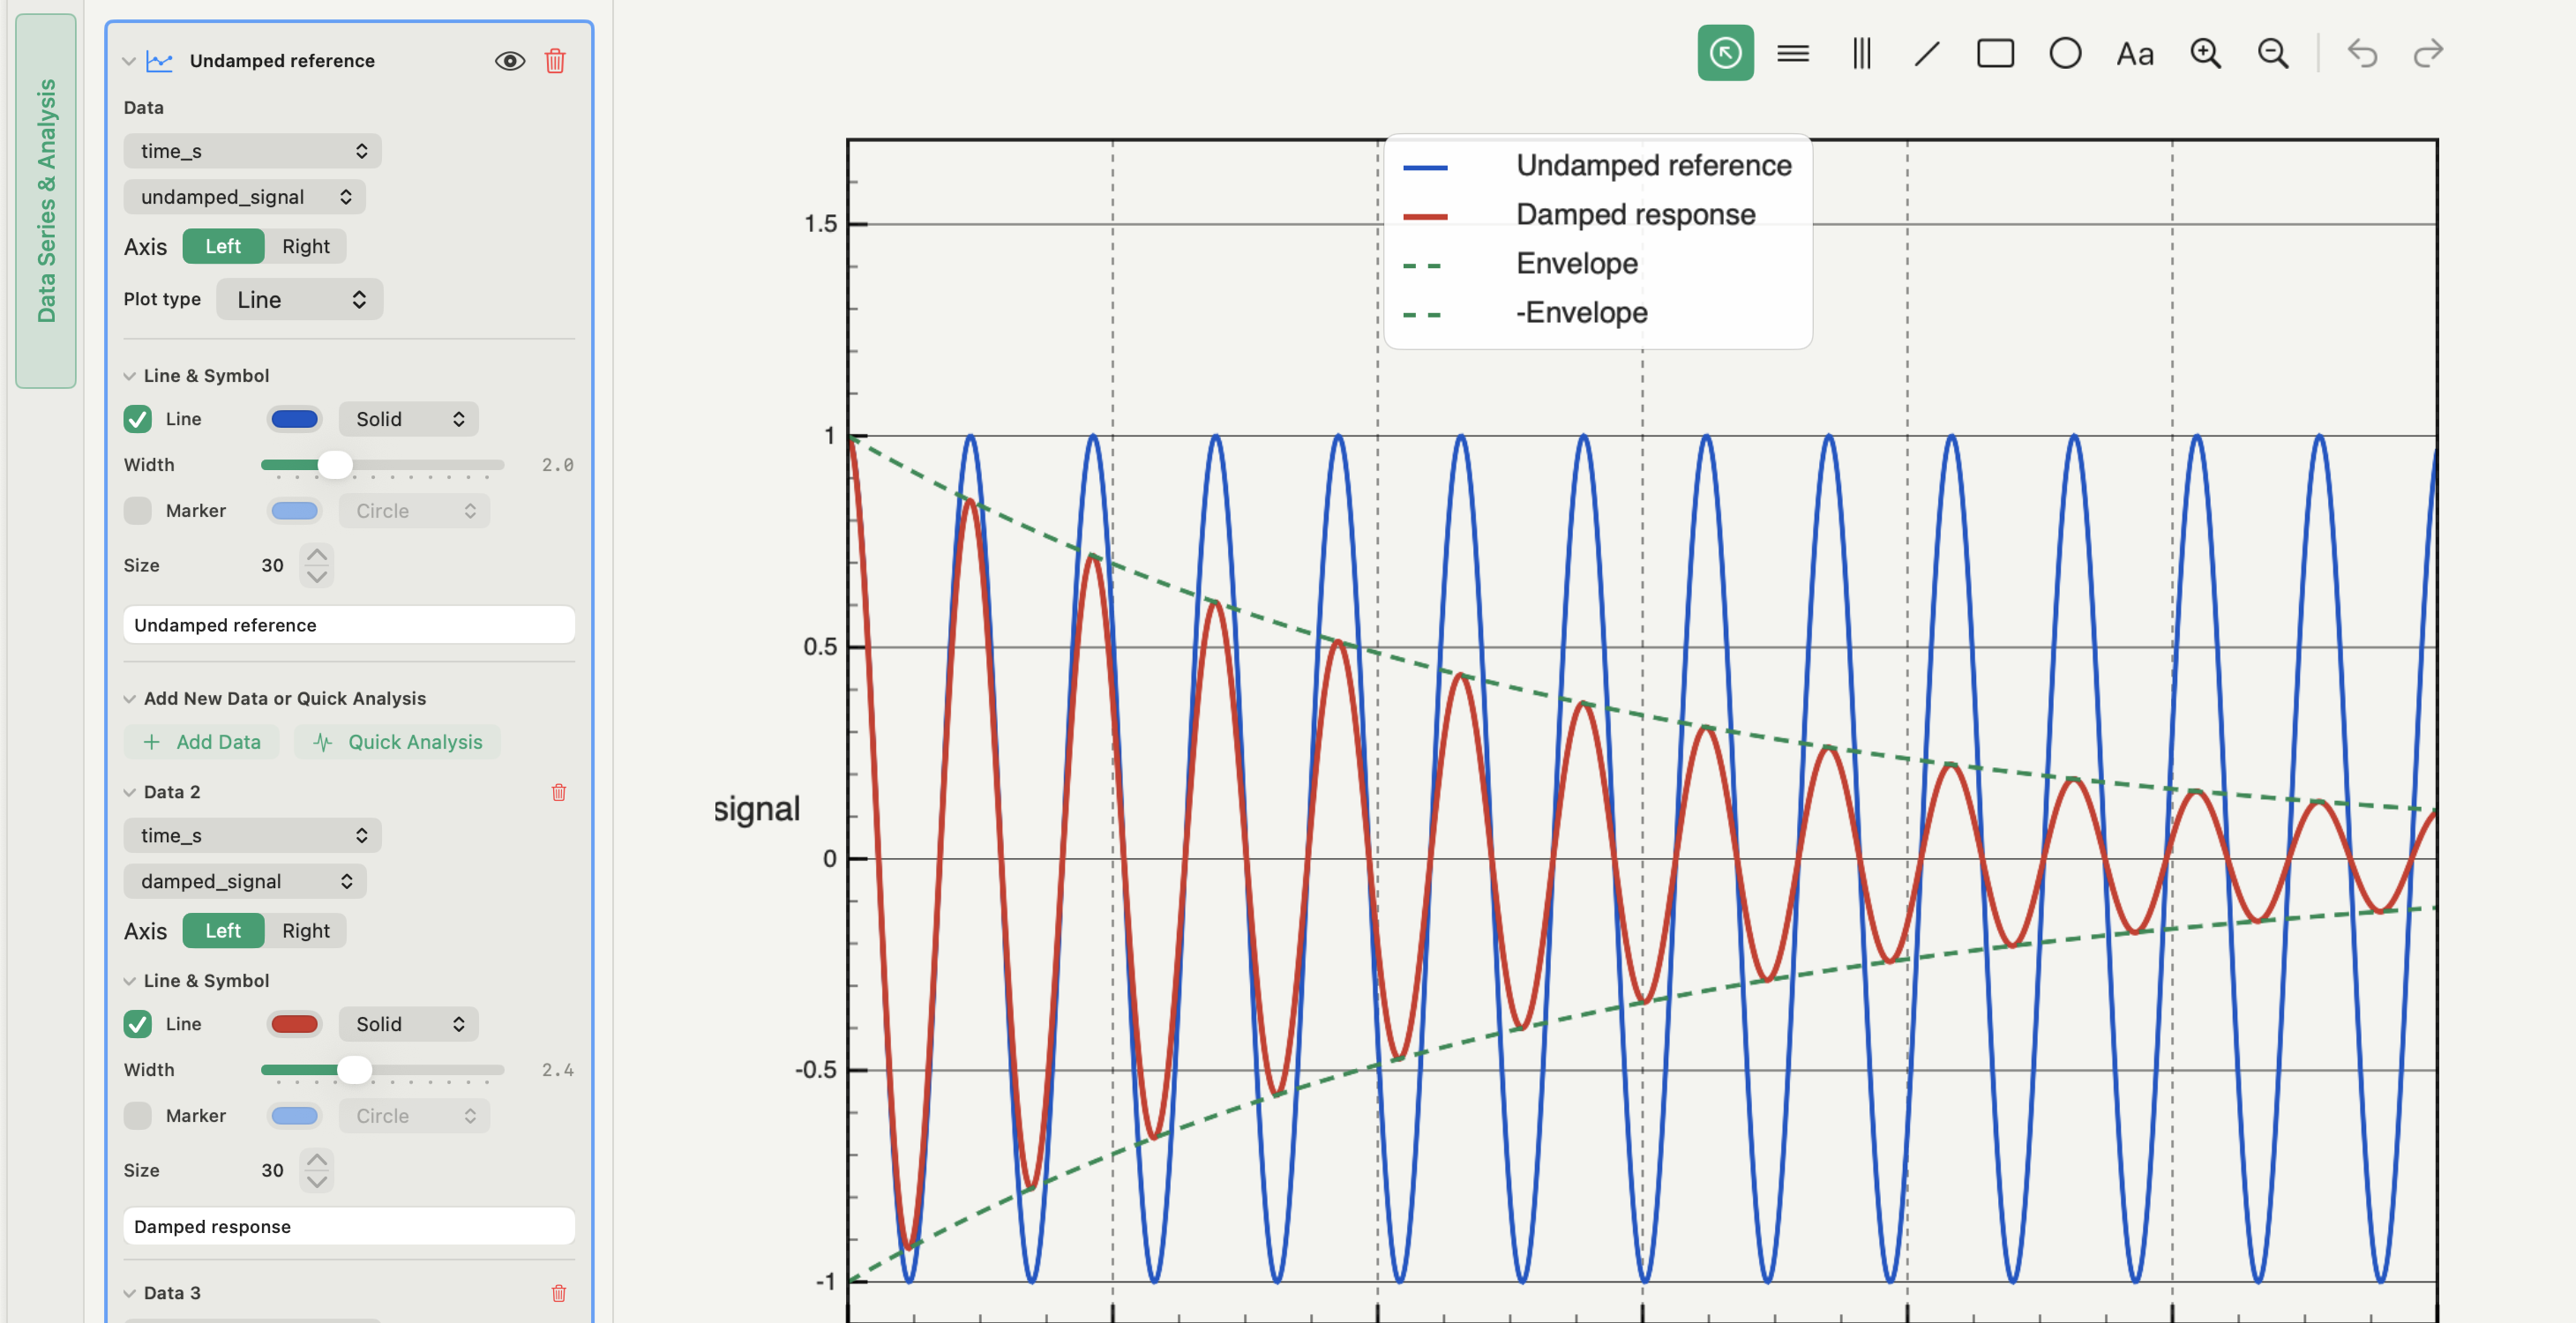
Overlay runs on one set of axes when the differences you want to show are small offsets or shape changes on a common scale. Switch to small multiples when overlays start to cover each other, when ranges differ by orders of magnitude, or when there are more runs than distinguishable colours.
- Give each run the same colour and line style in every figure of the set.
- Label series with the run, condition or file, not with the column name they all share.
- Show the full range of every run before trimming, so one truncated file does not look like a physical effect.
- When many runs repeat one condition, show the mean with a spread band and keep the individual runs available.
The guide on making a multi-panel figure covers aligning and labelling panels for a paper.
When a batch plot script is the better tool
If the deliverable is one identical figure per file for hundreds of files, or a pipeline that runs every night, write a script. In Python, the outline is short:
- List the files with
globand read each with pandasread_csv, setting the delimiter and header explicitly. - Validate each file against the expected columns, units and row counts, and log the ones that fail.
- Stack with
pandas.concat, passing the filenames askeysso the source survives. - Loop over runs, draw each figure with Matplotlib and save it at the final size.
A script is repeatable and auditable, and it is the right tool when nobody needs to look at every figure. An interactive tool is the better fit when inspecting the runs is part of the work.
Plotting multiple CSV files in Autoplot
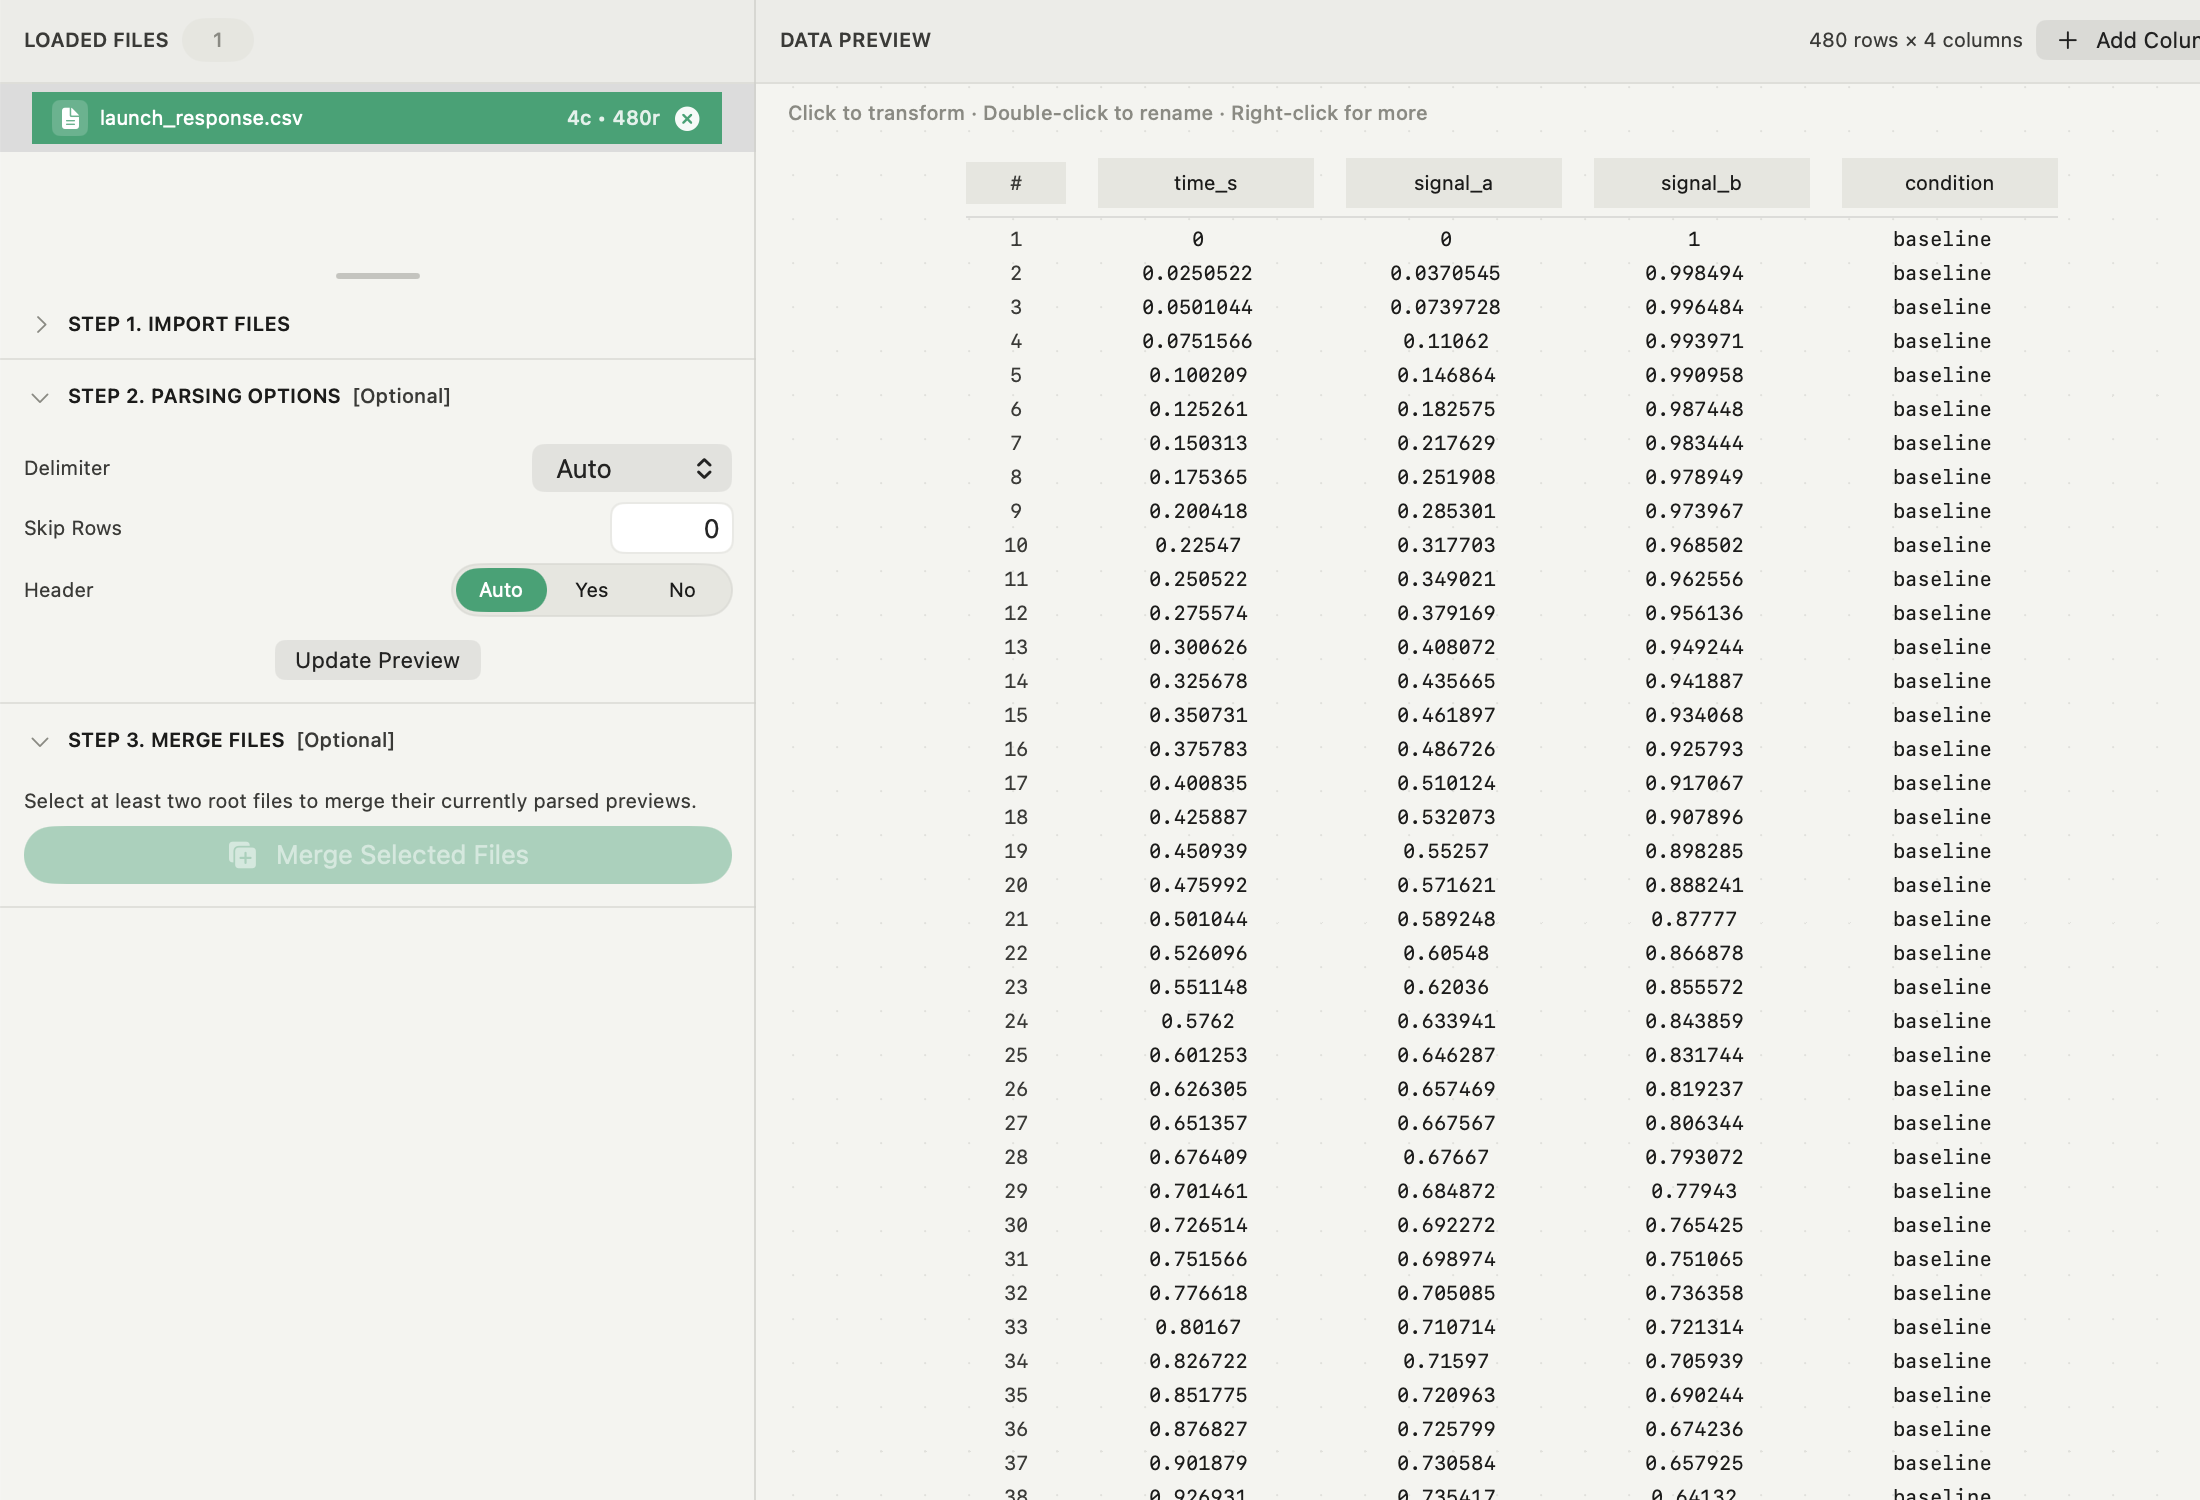
Native import. Select a batch of CSV, TSV or delimited text files, or drop them on the window. Each file gets its own tab with its own preview and parser settings (delimiter, skip rows, header). Merge stacks the selected parsed previews by column name into one file and records which source files each merged column came from; Undo Merge restores the originals. Merge does not add a per-row source column, so if you need to tell runs apart, add a numeric run column to each file first (Add Column, then fill it) or ask the assistant to do it.
Variables across many files. With several tabs selected, Create Variables from K Files creates one variable per column name, pooling that column's values across the selected files in order. For one series per run instead, create variables from each file's tab and rename them for the run. Overlay runs in an X&Y figure with Add Data; an Ensemble Summary overlay summarises related series on the same plot.
File operations by request. In Agent mode, the assistant can filter, split, summarise or merge files from a plain request, such as adding a run column to twelve files and stacking them. It writes Python and shows it to you before anything runs; the script can read and write only inside a working folder on your Mac, and a failed run restores the files it changed. With cloud models, only your request and column names leave the Mac, never the values.
Where it stops. Autoplot has no unattended step that renders and exports one figure per file across a folder, and no watched-folder pipeline. The assistant can build figures and exports from a request, but each run waits for your confirmation. For hundreds of identical outputs, use a script. See the features page for the import and assistant details.
Frequently asked questions
| How do I plot multiple CSV files on the same graph? | Make sure every file parses the same way and shares units and an X definition, then add one series per file to the same axes and label each by run. Merge the files into one table only if they are pieces of one dataset. |
|---|---|
| How do I merge CSV files that have different columns? | Stacking by column name keeps every column and leaves gaps where a file lacks one. Rename inconsistent headers first, so the same quantity ends up in one column. |
Sources
Autoplot behaviour comes from the app's documentation for import and source files, import preview column editing, variables, X&Y plots and the AI assistant, checked on 9 October 2026, and from the features page. The pandas references for read_csv and concat describe the parser options and the keys argument used in a scripted batch.