
On this page
- When a notebook is the long route to a figure
- Jupyter notebook alternative for plotting: choose by the job
- Where Jupyter remains the better choice
- Keep a Python handoff without plotting in a notebook
- Trial a Jupyter alternative on one notebook
- What Autoplot replaces in a notebook, and what it does not
- Frequently asked questions
When a notebook is the long route to a figure
A notebook is excellent for computing a result. It is less suited to the tenth revision of the same figure. The usual signs:
- The plotting code is longer than the analysis it displays.
- Changing an axis label or panel order means finding the right cell and re-running the ones above it.
- Hidden kernel state makes the figure depend on the order cells were run in.
- Environment drift changes fonts, defaults or package behaviour between machines.
- Colleagues who do not write Python cannot make a small revision themselves.
If most of these apply, the plotting has outgrown the notebook. If none do, the notebook is probably fine. For the broader choice among native apps, Windows-only tools and code, read scientific plotting software for Mac.
Jupyter notebook alternative for plotting: choose by the job
| Job | Better in Jupyter | Better in Autoplot |
|---|---|---|
| Custom algorithm, simulation or parameter sweep | Yes | Only through assistant-written Python |
| Narrative with code, equations and output in one document | Yes | No |
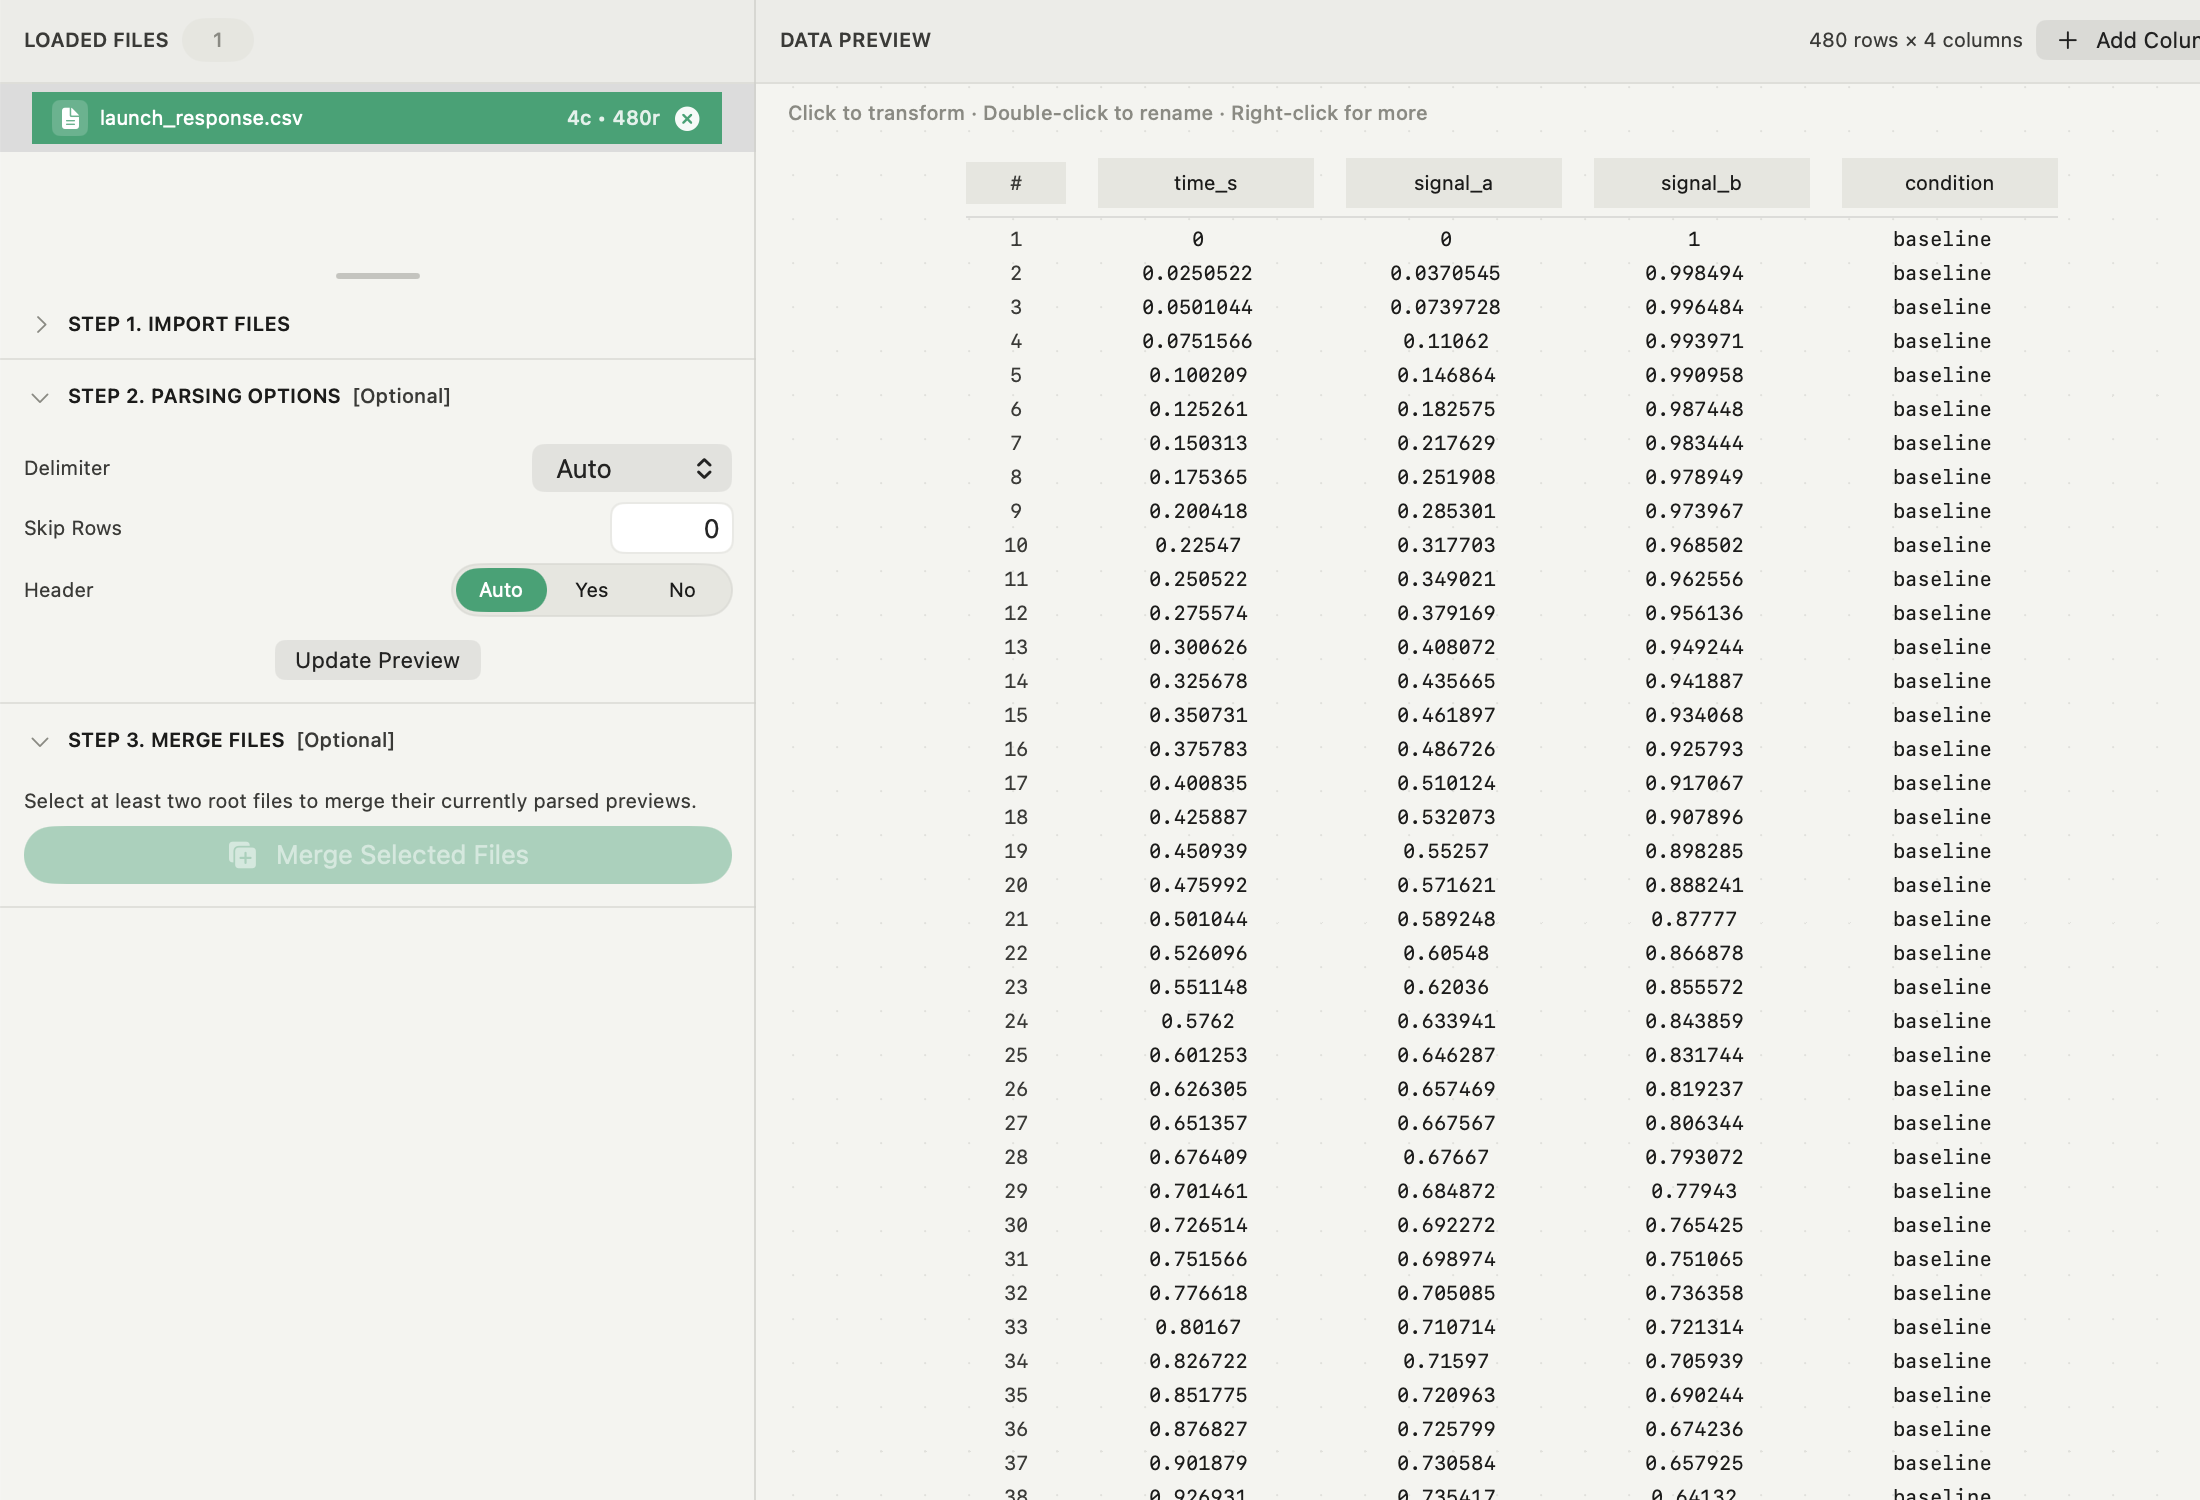
| Checking how a CSV file was parsed | Possible in code | Visible parser preview before commit |
| Revising ranges, labels, fits and panel layout | Edit and re-run cells | Direct controls beside the figure |
| 3D surface or scatter with camera control | Possible with code | Built-in 3D mode |
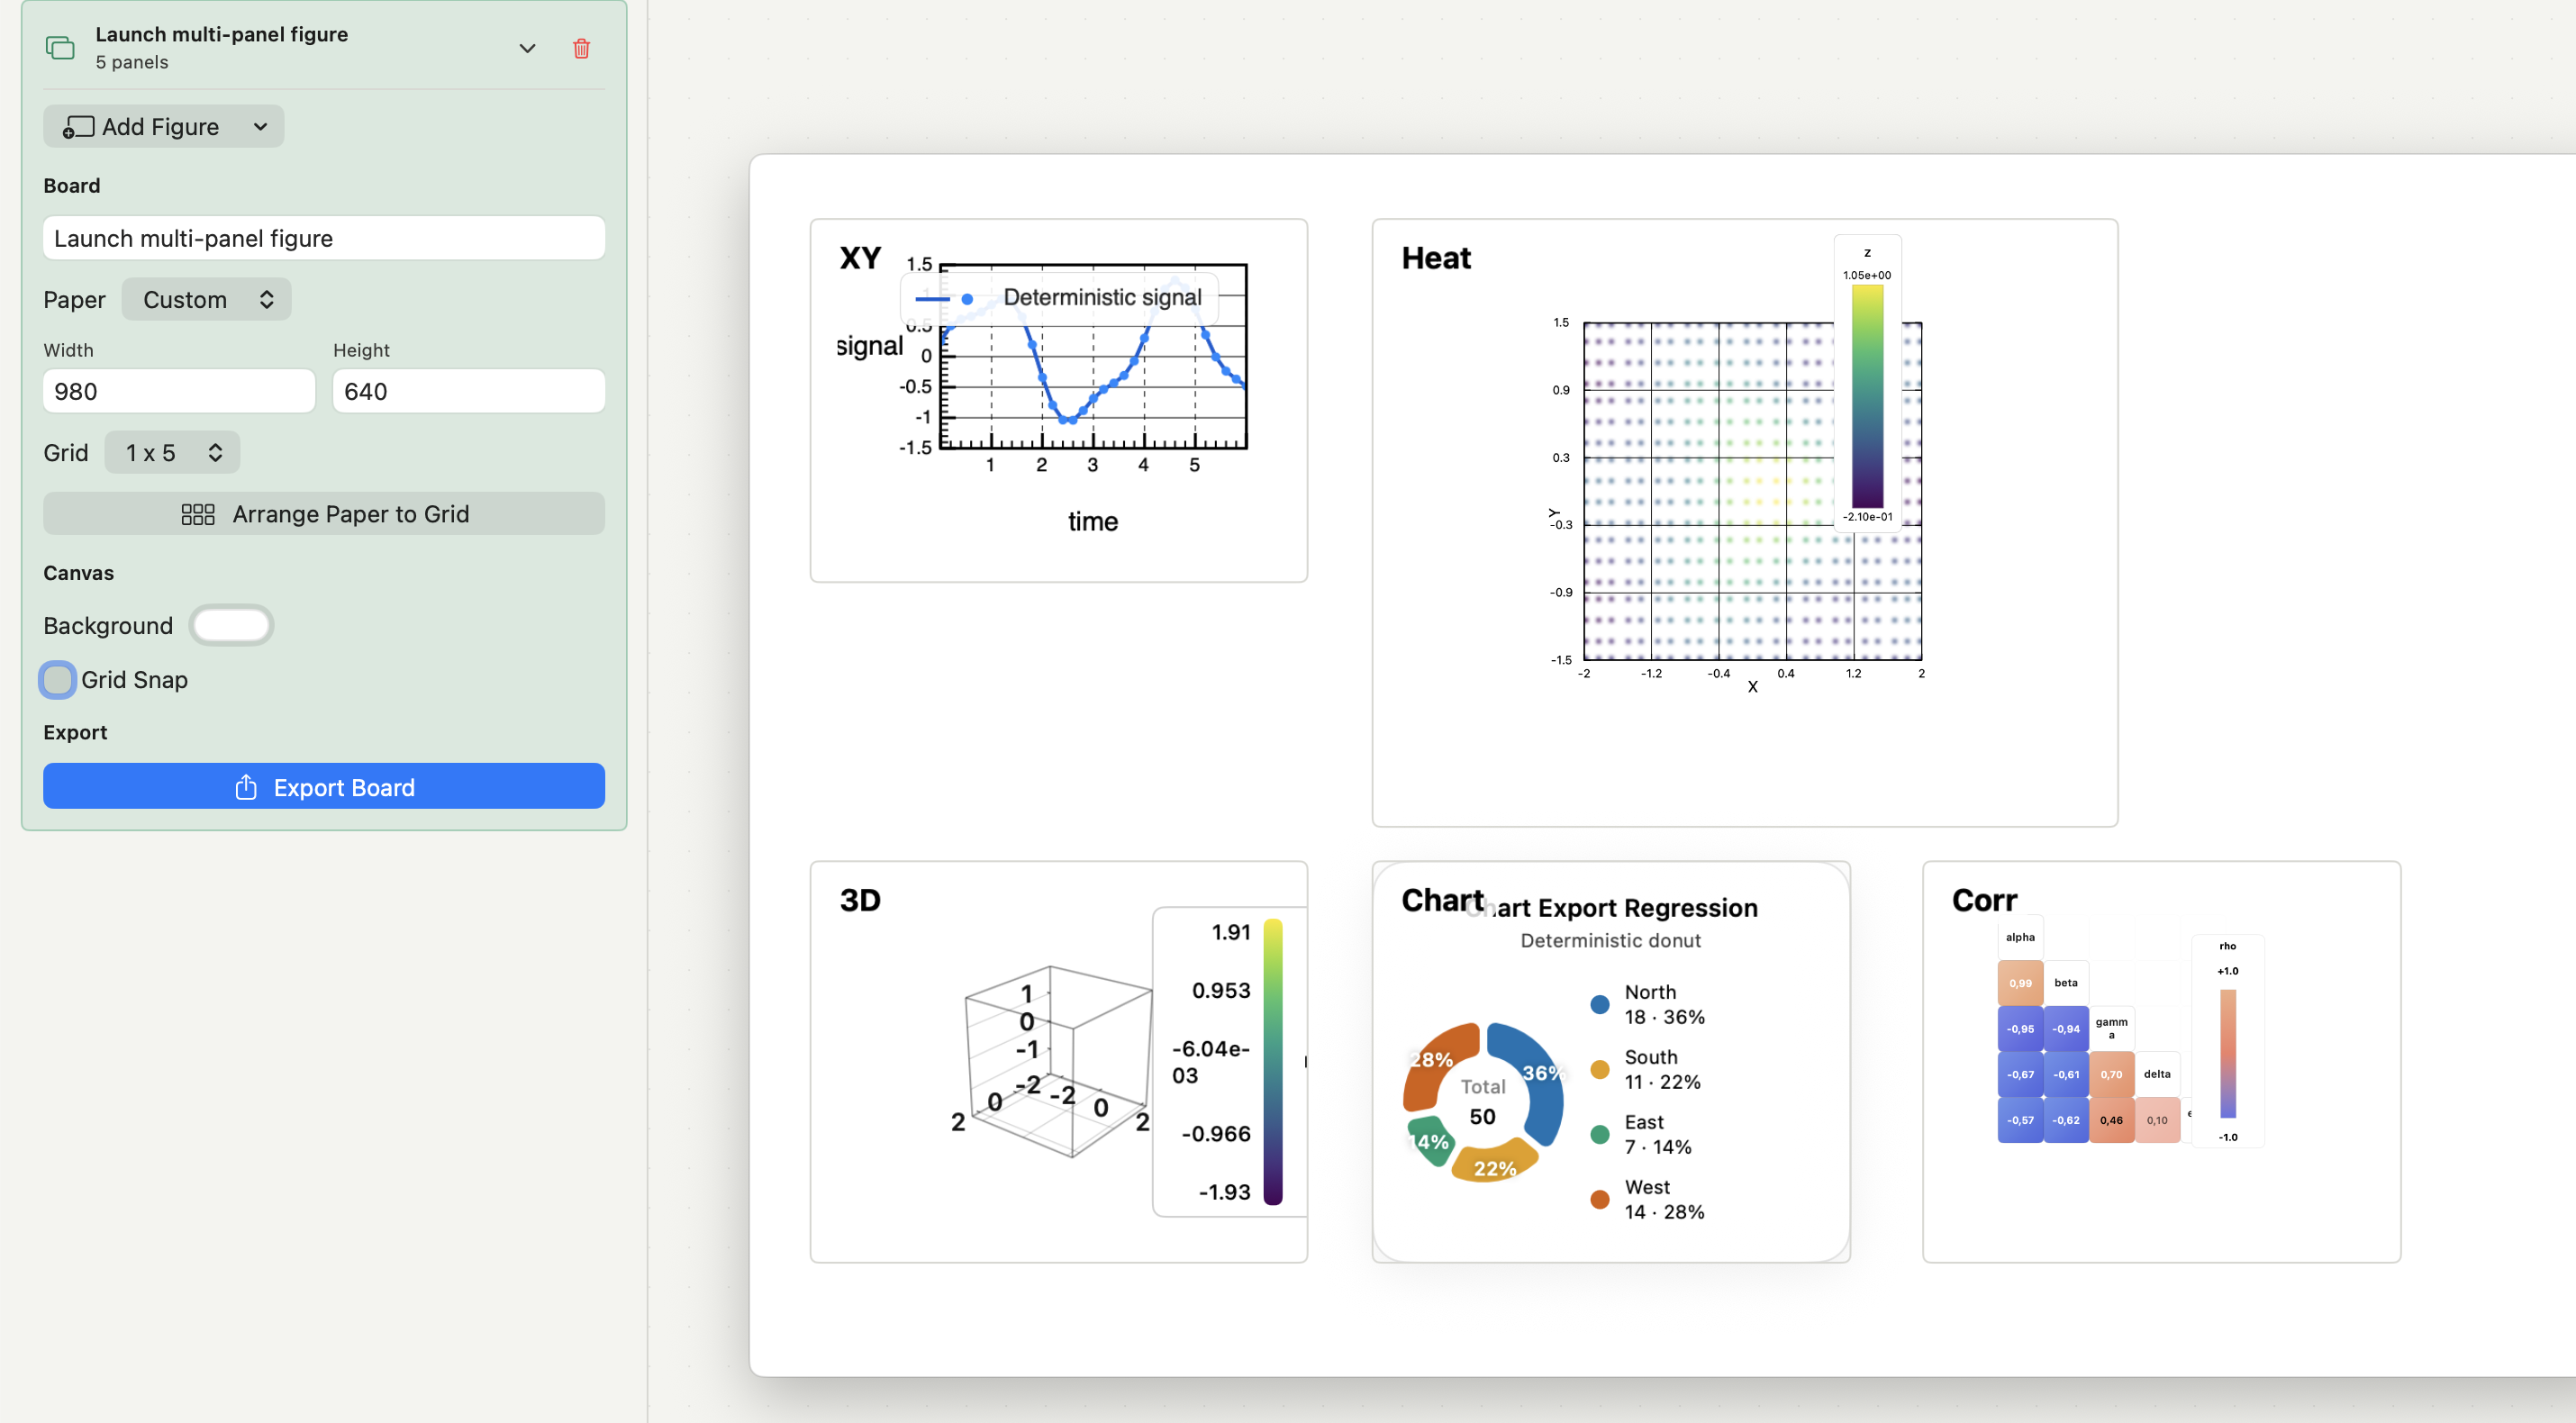
| Multi-panel figure on a paper-sized board | Possible with code | Compose |
| Collaborators on Windows or Linux | Yes | No; Autoplot is Mac-only |
| Processing many files unattended | Yes | No unattended per-file batch export |
The split is honest in both directions. Jupyter wins whenever code carries the scientific method; a visual workspace wins when the recurring cost is revision.
Where Jupyter remains the better choice
Jupyter notebooks combine executable code, prose, equations, visualisations and rich output in one shareable document. Kernels hold the interactive state and support many languages. That makes Jupyter the stronger foundation for custom methods, exploratory programming, teaching material and analyses that reviewers must read line by line.
Autoplot does not replace any of that. It does not open, run or export notebooks, it has no cell-by-cell narrative, and it runs only on macOS. Keep Jupyter wherever those are requirements rather than overhead, and see curve-fitting software for Mac if the open question is which tool can fit your model.
Keep a Python handoff without plotting in a notebook
Moving the figure out of the notebook does not mean losing the code. Autoplot offers three routes back to Python.
The assistant for anything not built in
Describe the operation, such as a transform, filter or model the cards do not cover. The assistant writes Python, shows it to you before it runs, runs it on your Mac inside a working folder and keeps the script. With cloud models, only your request and column names leave the Mac, never the values.
Export Matplotlib for one figure
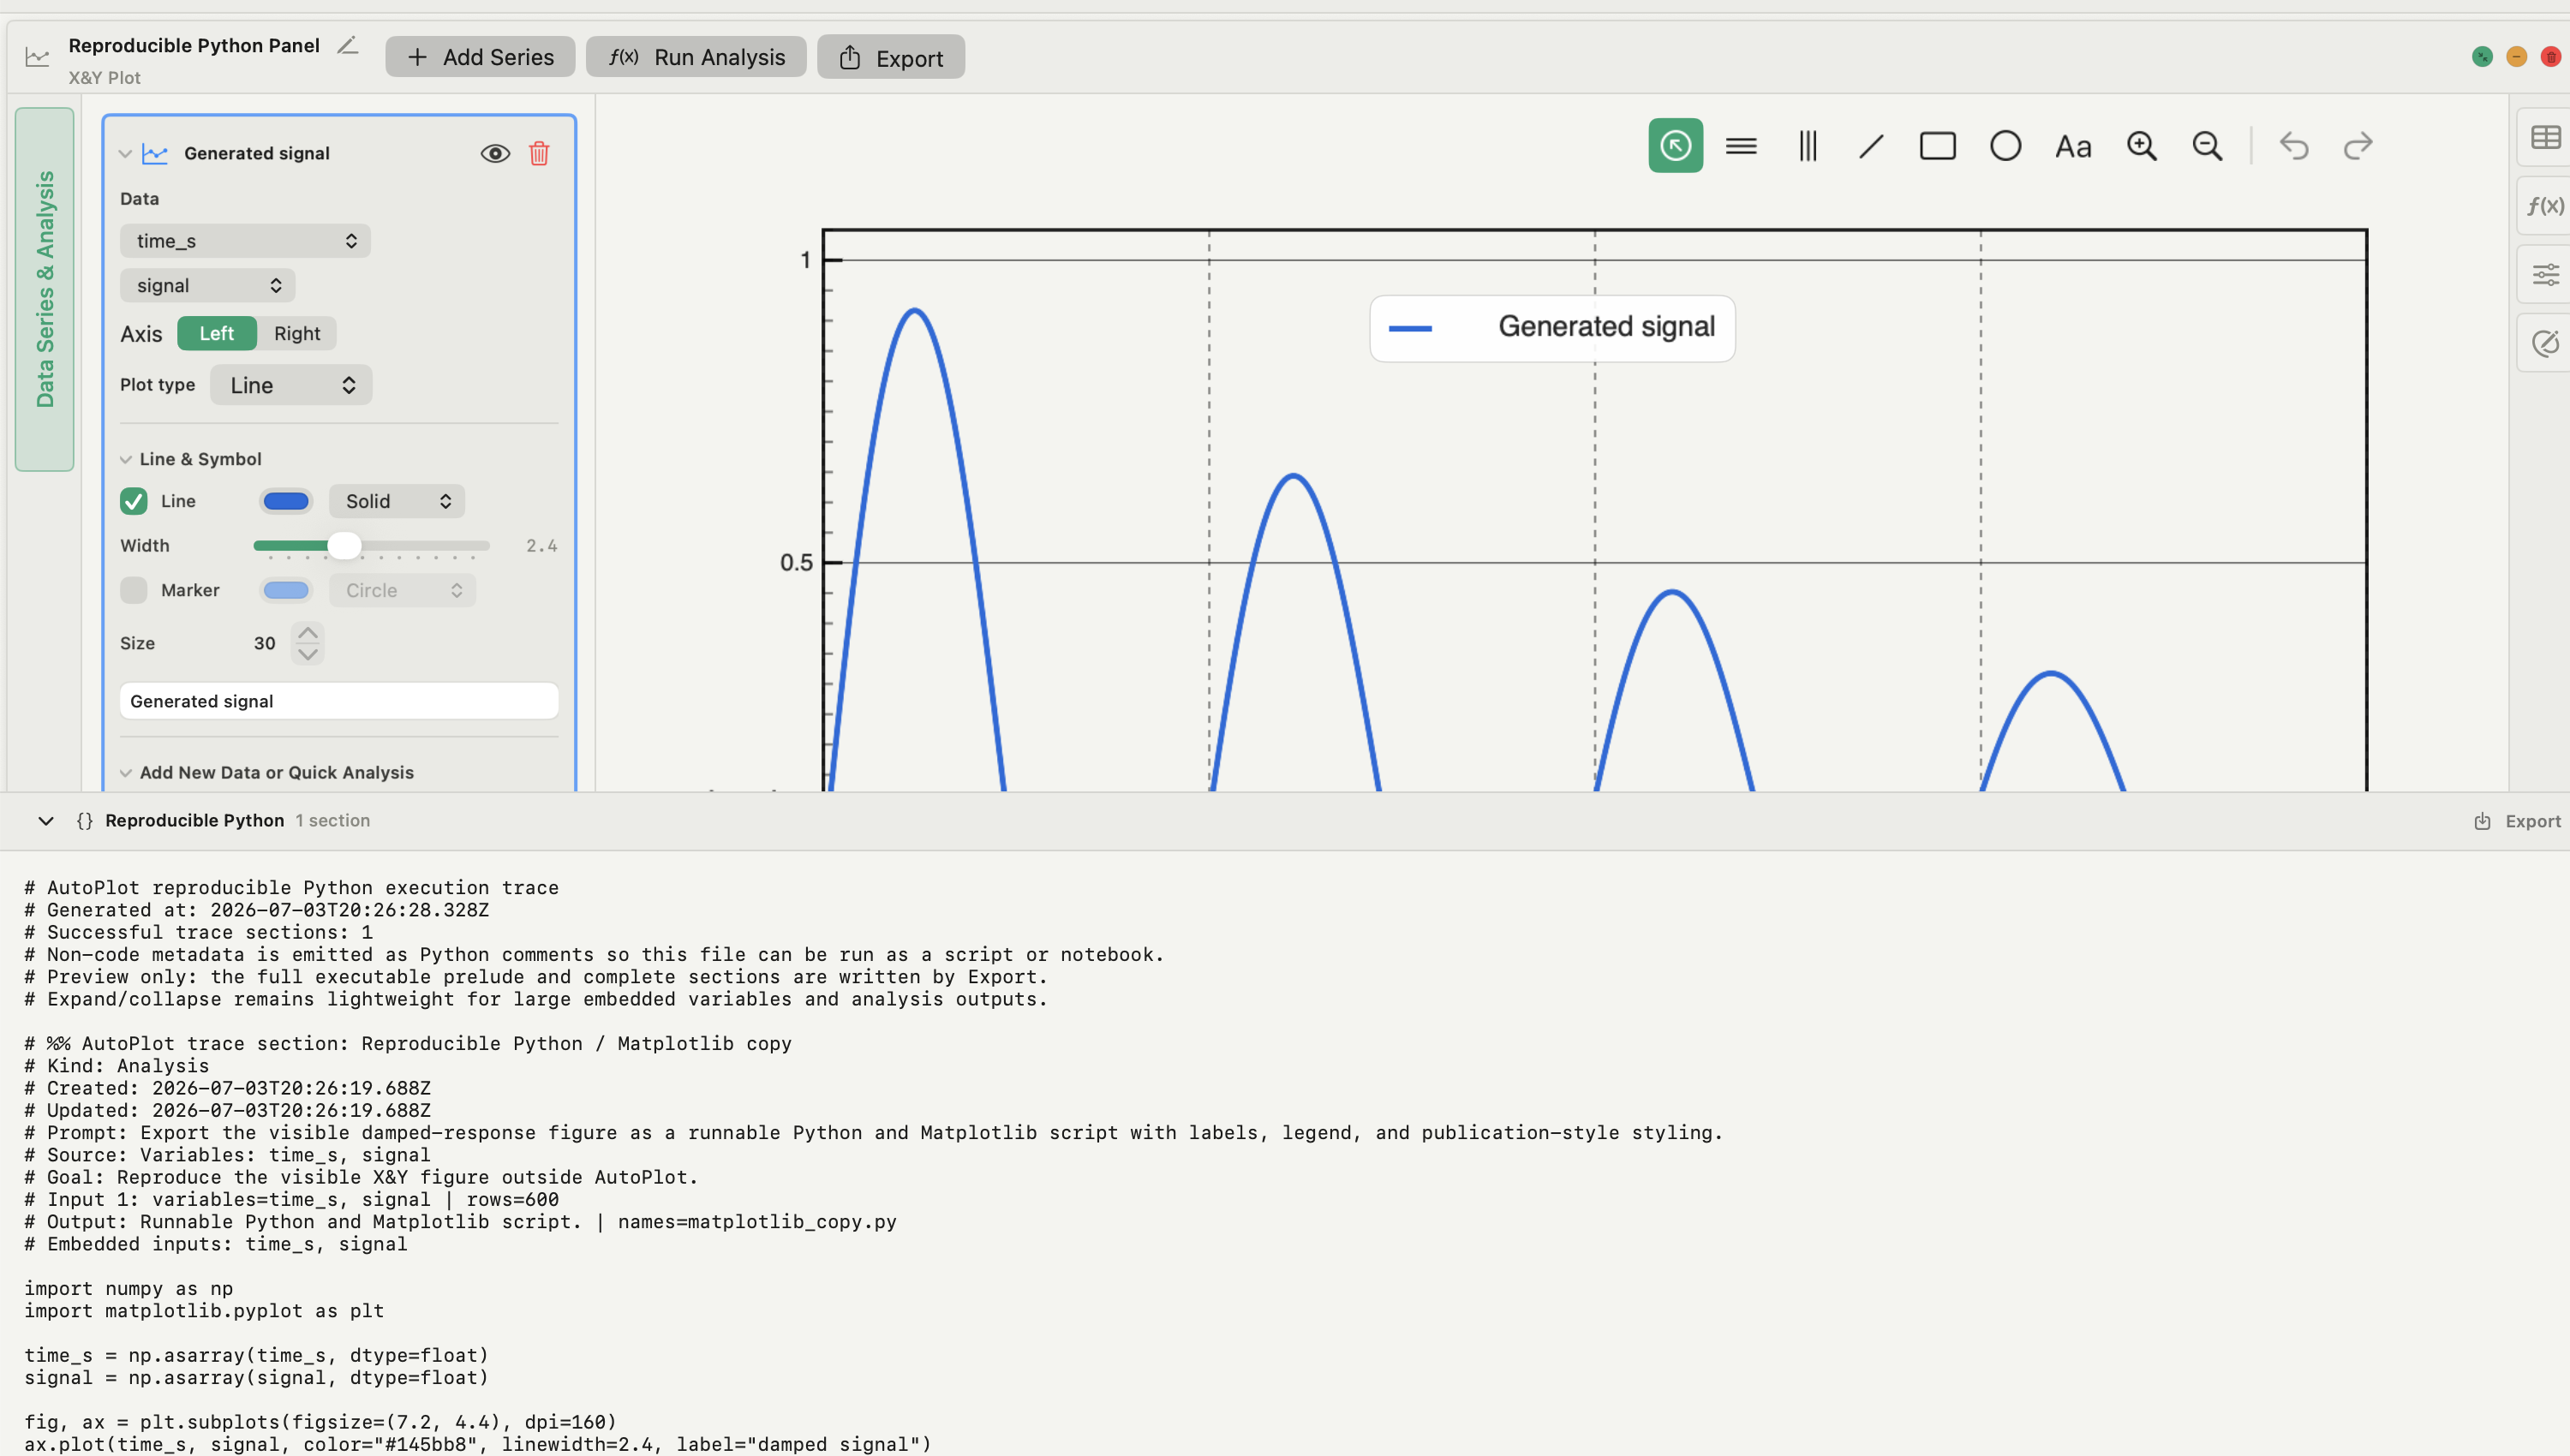
Export Matplotlib writes a selected figure as a readable Python script with an adjacent compressed NumPy data file. Run it to open a Matplotlib window, or with --save output.pdf for a static file. Unsupported visible content is reported before files are written. Keep the script and data file together; the script finds its data relative to its own location.
The Reproducible Python trace
The trace records supported import, variable, assistant and Python-backed analysis steps and exports them as one script, to run in a Python environment with the required packages. It is an audit and reproduction aid. It does not replay every style setting or a Compose layout.
Trial a Jupyter alternative on one notebook
- Choose a notebook whose main output is a figure you revise more than once.
- Export the relevant tidy table with clear column names, and keep the notebook as the upstream record.
- Import the table and verify delimiter, header row, row count and missing values.
- Rebuild the figure and one result you already trust. Compare the numbers, scales and exclusions, not only the picture.
- Make a realistic revision: a new range, label, fit or panel arrangement.
- Export the real PDF or raster file and inspect it at its final size.
- Keep Jupyter for any step that lost required code, narrative or method depth.
For a step-by-step first import, follow how to plot CSV data on a Mac.
What Autoplot replaces in a notebook, and what it does not
Autoplot keeps the imported table, named and derived variables, X&Y plots, histograms, heat maps, 3D plots, correlation matrices, analysis cards and Compose boards in one local .elab project on your Mac. Changes happen through controls beside the figure, and export covers PNG, JPEG and vector PDF with embedded fonts at journal sizes and DPI. Analysis cards run tested Python implementations locally and write results back as variables.
It is not a notebook environment: it does not open, run or export .ipynb files, and it does not run on Windows or Linux. Its built-in methods are a fixed set; anything else goes through the assistant's Python or your own environment. Heat maps, 3D, correlations and Compose are part of Plus. See the features page for the full list and pricing for plans.
Frequently asked questions
| Can Autoplot open a Jupyter notebook? | No. It does not open, run or export .ipynb files. Export a CSV or TSV table from the notebook and import that. |
|---|---|
| Can I get Python code back out of Autoplot? | Yes. Export Matplotlib writes a supported figure as an editable script with its data, the Reproducible Python trace exports supported analysis steps, and the assistant keeps the scripts it runs. |
Sources
Autoplot statements come from the app's documentation for import, Compose and export, the Reproducible Python trace and Export Matplotlib, and the assistant, checked on 9 October 2026, and from the features page. Jupyter's official documentation describes notebooks as documents combining code, prose, equations, visualisations and rich output; its architecture documentation covers the notebook format and kernels, and the installation page covers JupyterLab and Notebook on a Mac.