
On this page
Scientific plotting software for Mac, compared
Each scientific graphing option below is the better choice for some laboratory. The table says how each one runs on a current Mac and the situation in which it earns its place.
| Tool | On a Mac | Choose it when |
|---|---|---|
| Autoplot | Native on Apple silicon, macOS 15 or later | The work moves between a table, 2D and 3D plots, supported analyses and a journal figure |
| DataGraph | Native Mac application | You build 2D graphs from columns and its mature command workflow already fits |
| GraphPad Prism | Native; also on Windows | The analysis is a guided statistical test or curve fit |
| Igor Pro | 9.05 is the last Mac release; Intel, Rosetta 2 on Apple silicon | Existing experiments, procedures or acquisition setups depend on Igor |
| Origin / OriginPro | Windows only; on a Mac through virtualisation | You need its analysis catalogue, templates or existing Origin projects |
| Python (Matplotlib, Jupyter) | Cross-platform | The method is custom, automated or must be reviewed as code |
| R | Cross-platform | The statistics live in R packages or the team already works in R |
| MATLAB | macOS, Windows and Linux | Toolboxes, existing scripts or Simulink models define the work |
No row is a ranking. A tool that makes an excellent chart can still cost hours at import, revision, collaboration or export, which is why the trial below matters more than the table.
Map the whole workflow before choosing
Mac data analysis software for scientists is judged on the full path from instrument to deliverable, not on the plot gallery. Write down each stage for one real project:
- Handoff: who produces the data, in which format, with which units and metadata. Convert instrument-specific files upstream and keep the original.
- Preparation: filtering, splitting, alignment and derived variables. Visual tools handle routine cases well; code is stronger for large, irregular or heavily automated transformations.
- Method depth: the exact model, constraints, diagnostics and uncertainty you must report. A curve labelled "fit" is not the same as the checks that make it defensible.
- Revision: how often a range, variable, model, label or panel changes after the first draft, and whether that change happens in the same place as the analysis.
- Reproducibility and collaboration: whether reviewers need an editable project, a script, a notebook, a data package or several of these, and on which operating systems.
- Deliverable: a checked number, an interactive app, one figure or a multi-panel PDF at journal size. The deliverable often decides the tool more reliably than the longest feature list.
Weight the stages that consume real time. A rarely used method should not outweigh a daily import or revision problem.
Native Mac data analysis software
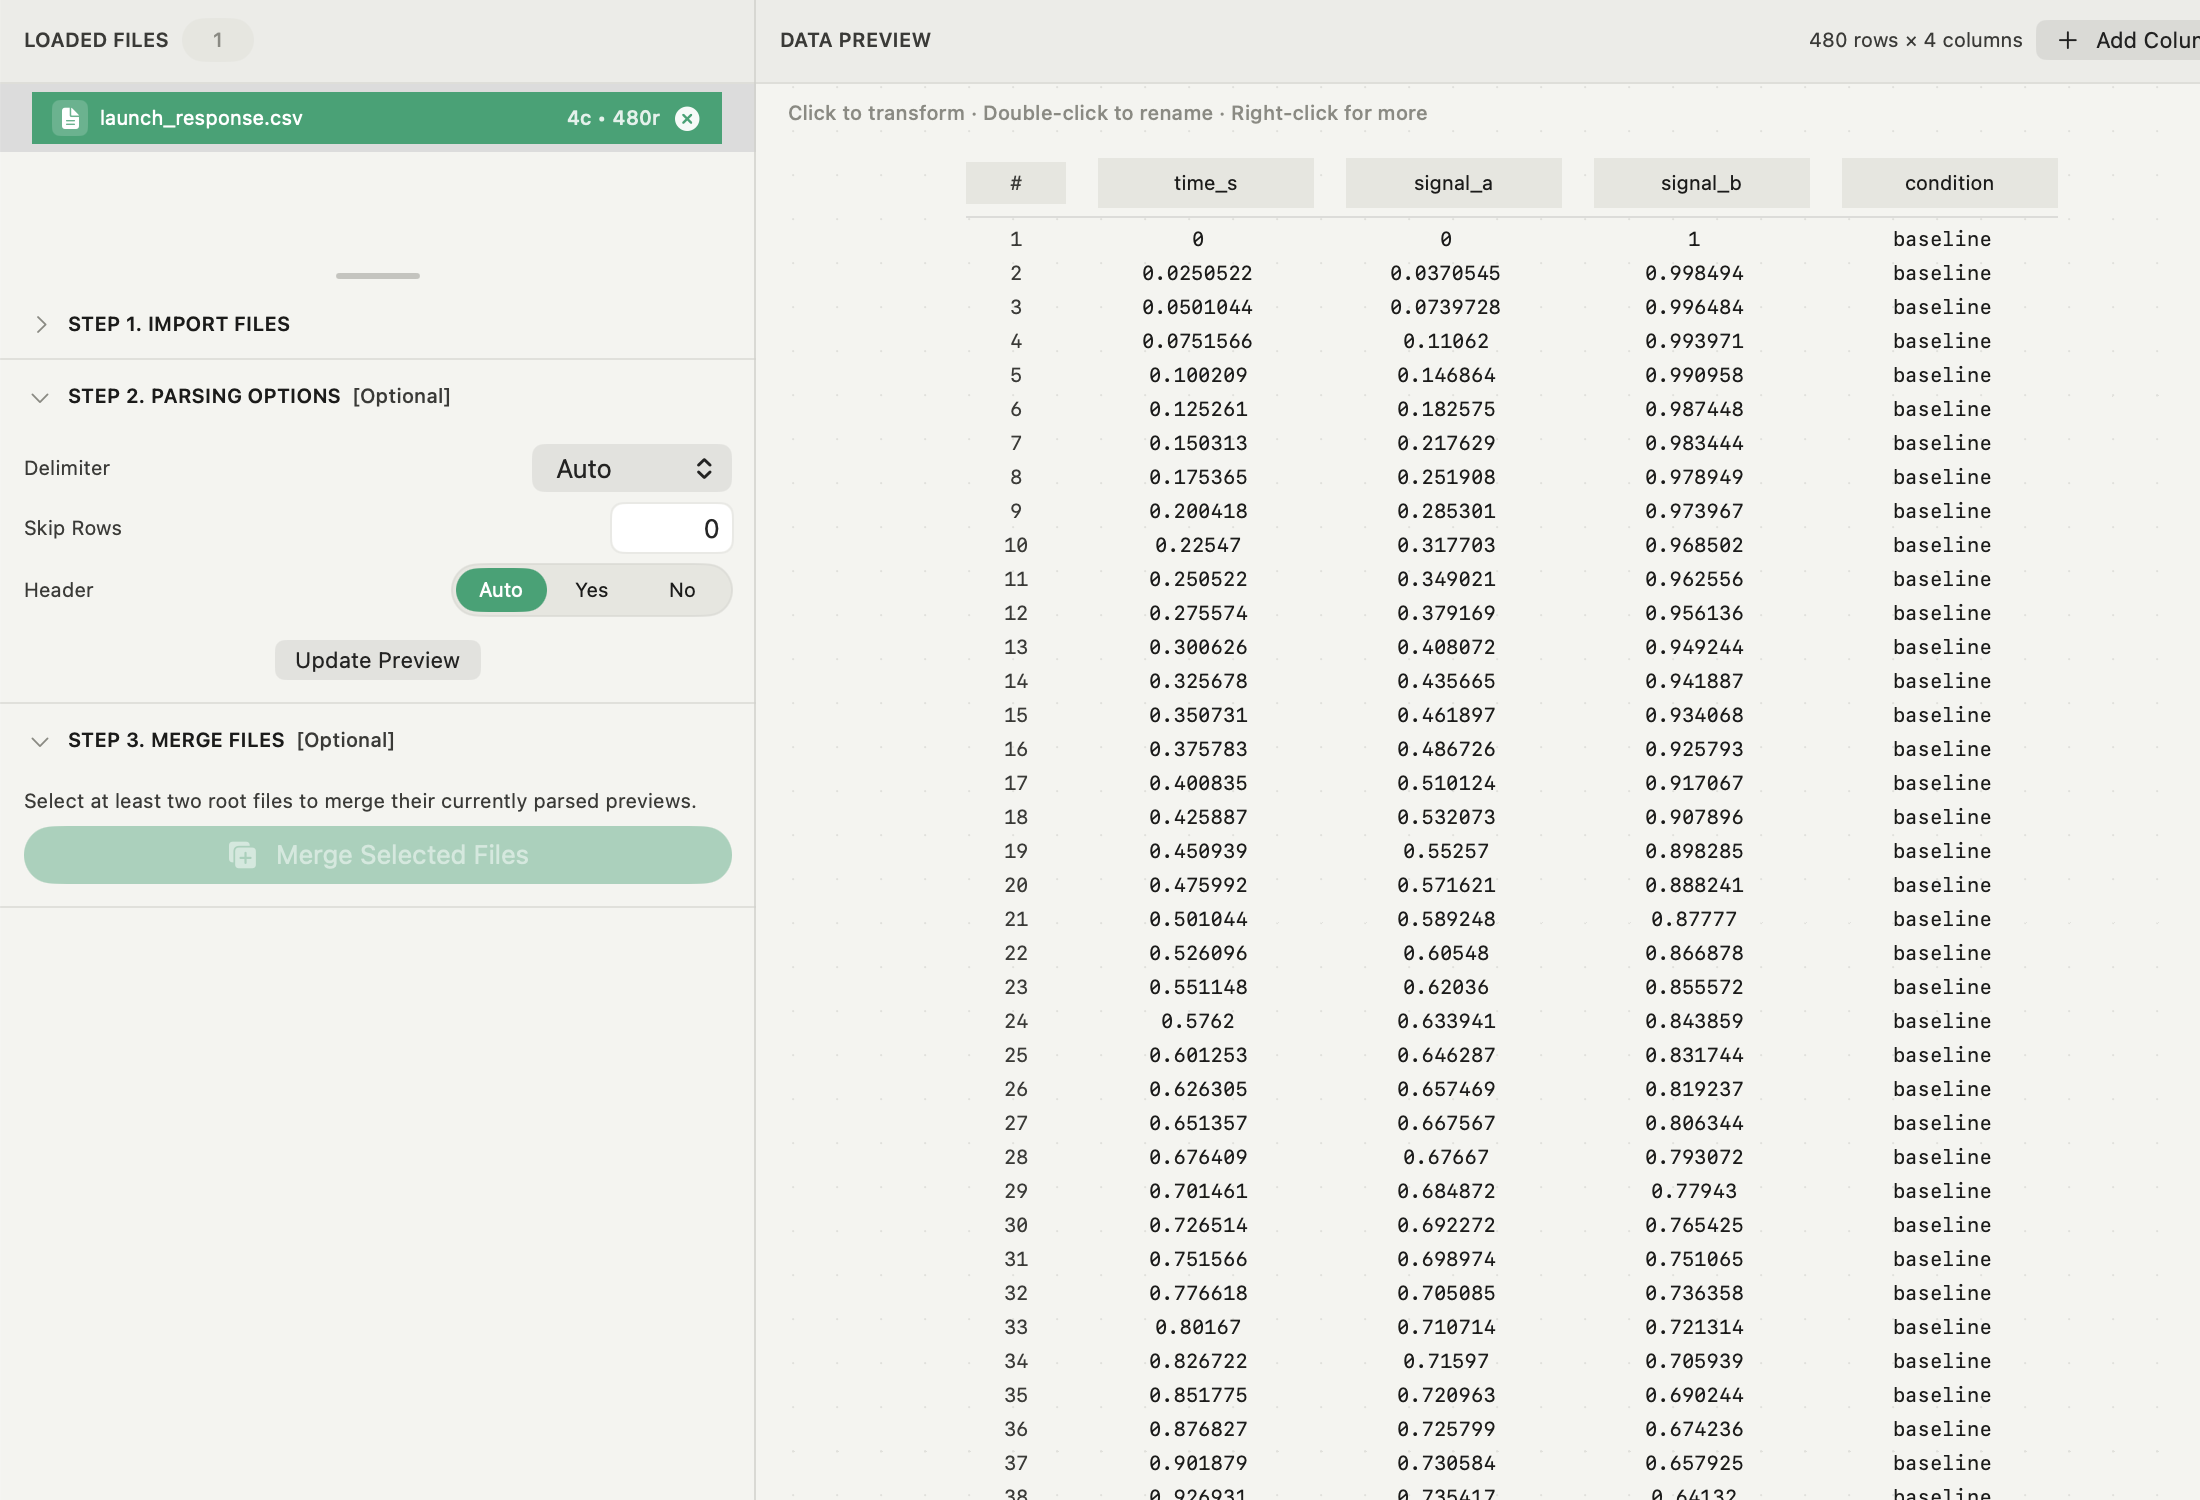
A native application keeps table inspection, plot controls, keyboard behaviour, appearance and file handling consistent with the rest of the Mac, and it needs no virtual machine. Three native options cover different jobs.
- DataGraph builds 2D graphs from columns, with transforms, fitting and graph combination. Its manual describes a deliberate two-dimensional focus. The DataGraph alternative guide covers when that focus becomes a limit.
- GraphPad Prism centres on guided statistics and curve fitting. If the core of the work is choosing and running a statistical test, start with its feature list.
- Autoplot keeps import, variables, 2D and 3D plots, analysis cards, multi-panel composition and export in one local project. The product section below says where it stops.
Igor Pro and Origin on a Mac today
Both are deep scientific environments, and both have moved away from native macOS.
- Igor Pro: WaveMetrics lists Igor Pro 9 as the last Mac version. It is compiled for Intel, so Apple-silicon Macs run it through Rosetta 2. Igor Pro 10 runs on macOS only inside a Windows virtual environment.
- Origin and OriginPro: OriginLab describes Origin as a native Windows application. On Apple silicon it recommends Parallels Desktop with Windows 11 on ARM. A free native Mac Origin Viewer opens and exports files but is not the full application.
Neither situation forces a switch. Keep the existing experiments and projects where they work, and decide where new work should live. The Igor Pro alternative guide and the OriginPro alternative guide cover migration limits in detail. If you fit spectra in MagicPlot, read the MagicPlot alternative guide for what to keep there.
When code is worth the setup
Code is the right foundation for custom algorithms, simulations, parameter sweeps, unattended processing of many files, and analyses that must be reviewed line by line.
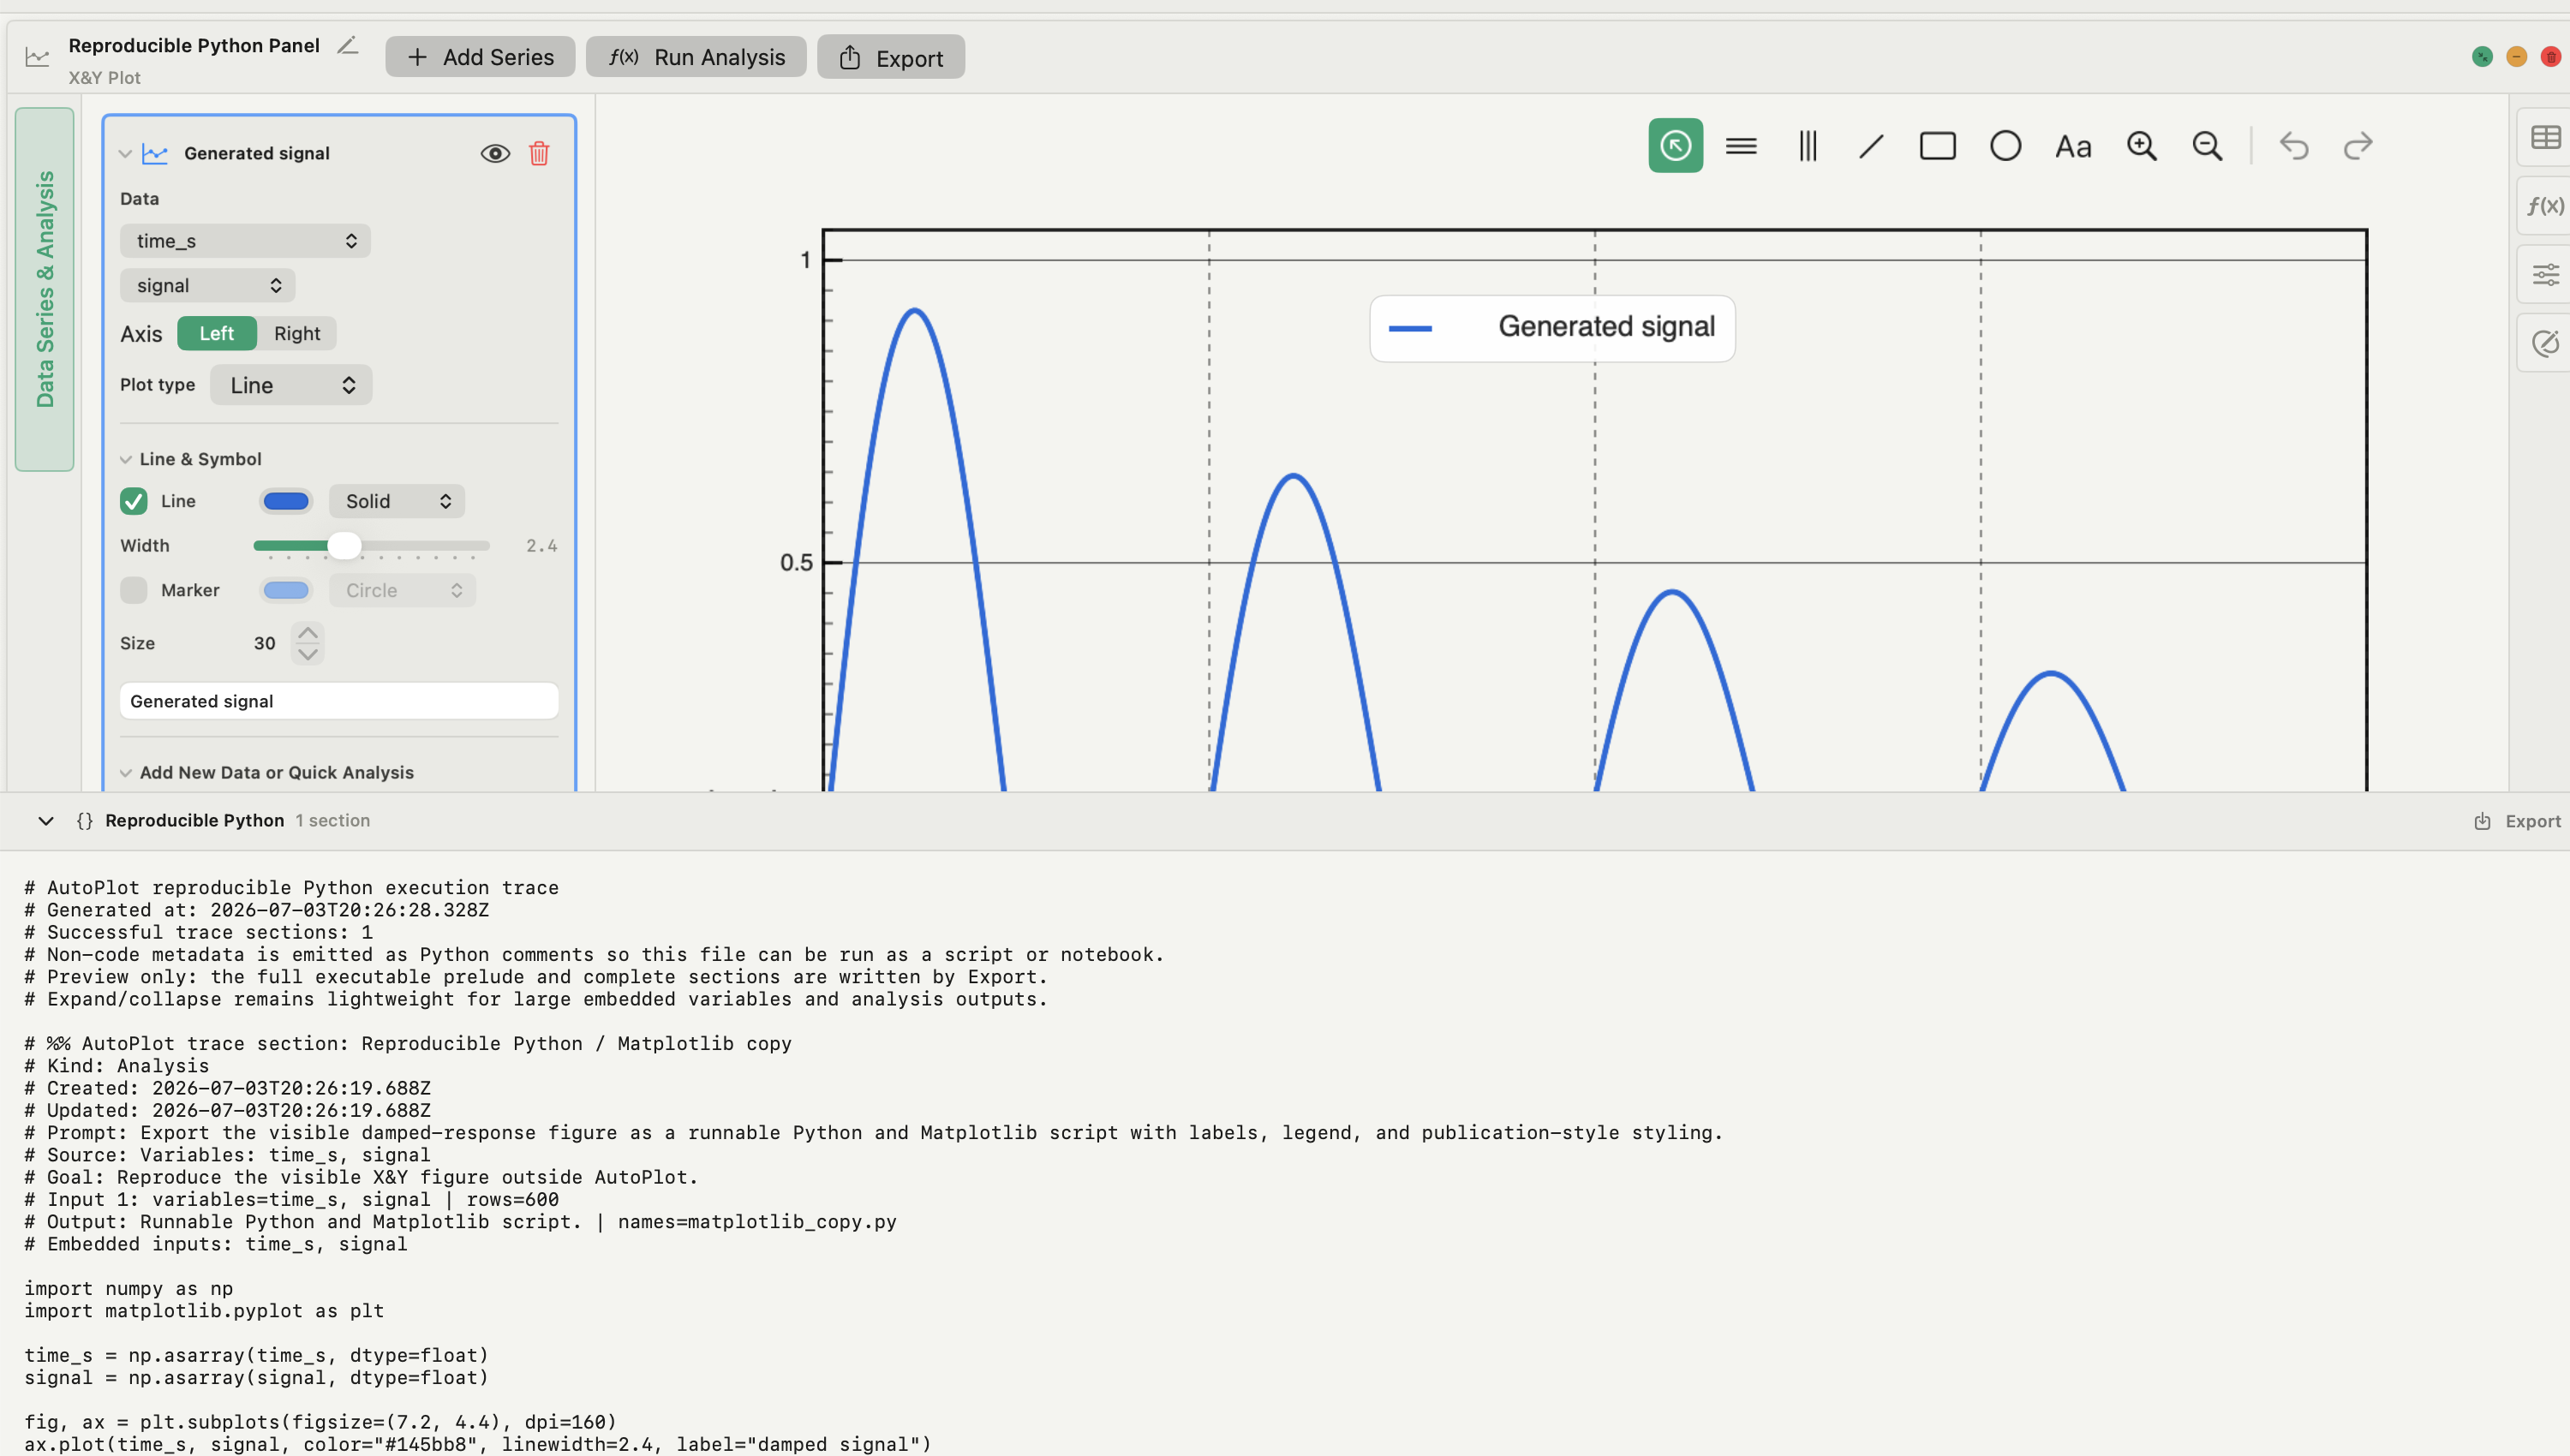
- Python with Matplotlib and Jupyter combines open libraries, executable notebooks and full control over the figure. The cost is environment management: versions, dependencies and rendering backends need to be pinned.
- R is a free environment for statistical computing and graphics, strongest when the method lives in an R package.
- MATLAB combines numerical computing, visualisation and optional toolboxes, and is often fixed by existing scripts or Simulink models.
Code and a visual workspace are not exclusive. Many groups compute upstream in code and finish figures by hand. The Jupyter alternative guide covers that split, and the Plotly Studio alternative guide covers the case where the deliverable is an interactive data app rather than a fixed figure.
Run a one-project trial before switching
- Pick a source file that contains the parsing problem, plot type, analysis and export format that make your work difficult. Keep its acquisition context.
- Import it and verify units, missing values, derived variables and the expected row count.
- Reproduce one result you already trust, and compare the settings and the numbers, not only the picture.
- Make a realistic revision: a new variable, range, model, label or panel arrangement.
- Save, close and reopen the project. Note anything that must be recomputed or was lost.
- Export the real deliverable and inspect the saved file at its final size: dimensions, fonts, line weights and colour.
- Give the project or handoff to a collaborator and record what they can reproduce without extra explanation.
For the fitting side of the decision, compare curve-fitting software for Mac. For a concrete first run, follow how to plot CSV data on a Mac.
Where Autoplot fits, and where it stops
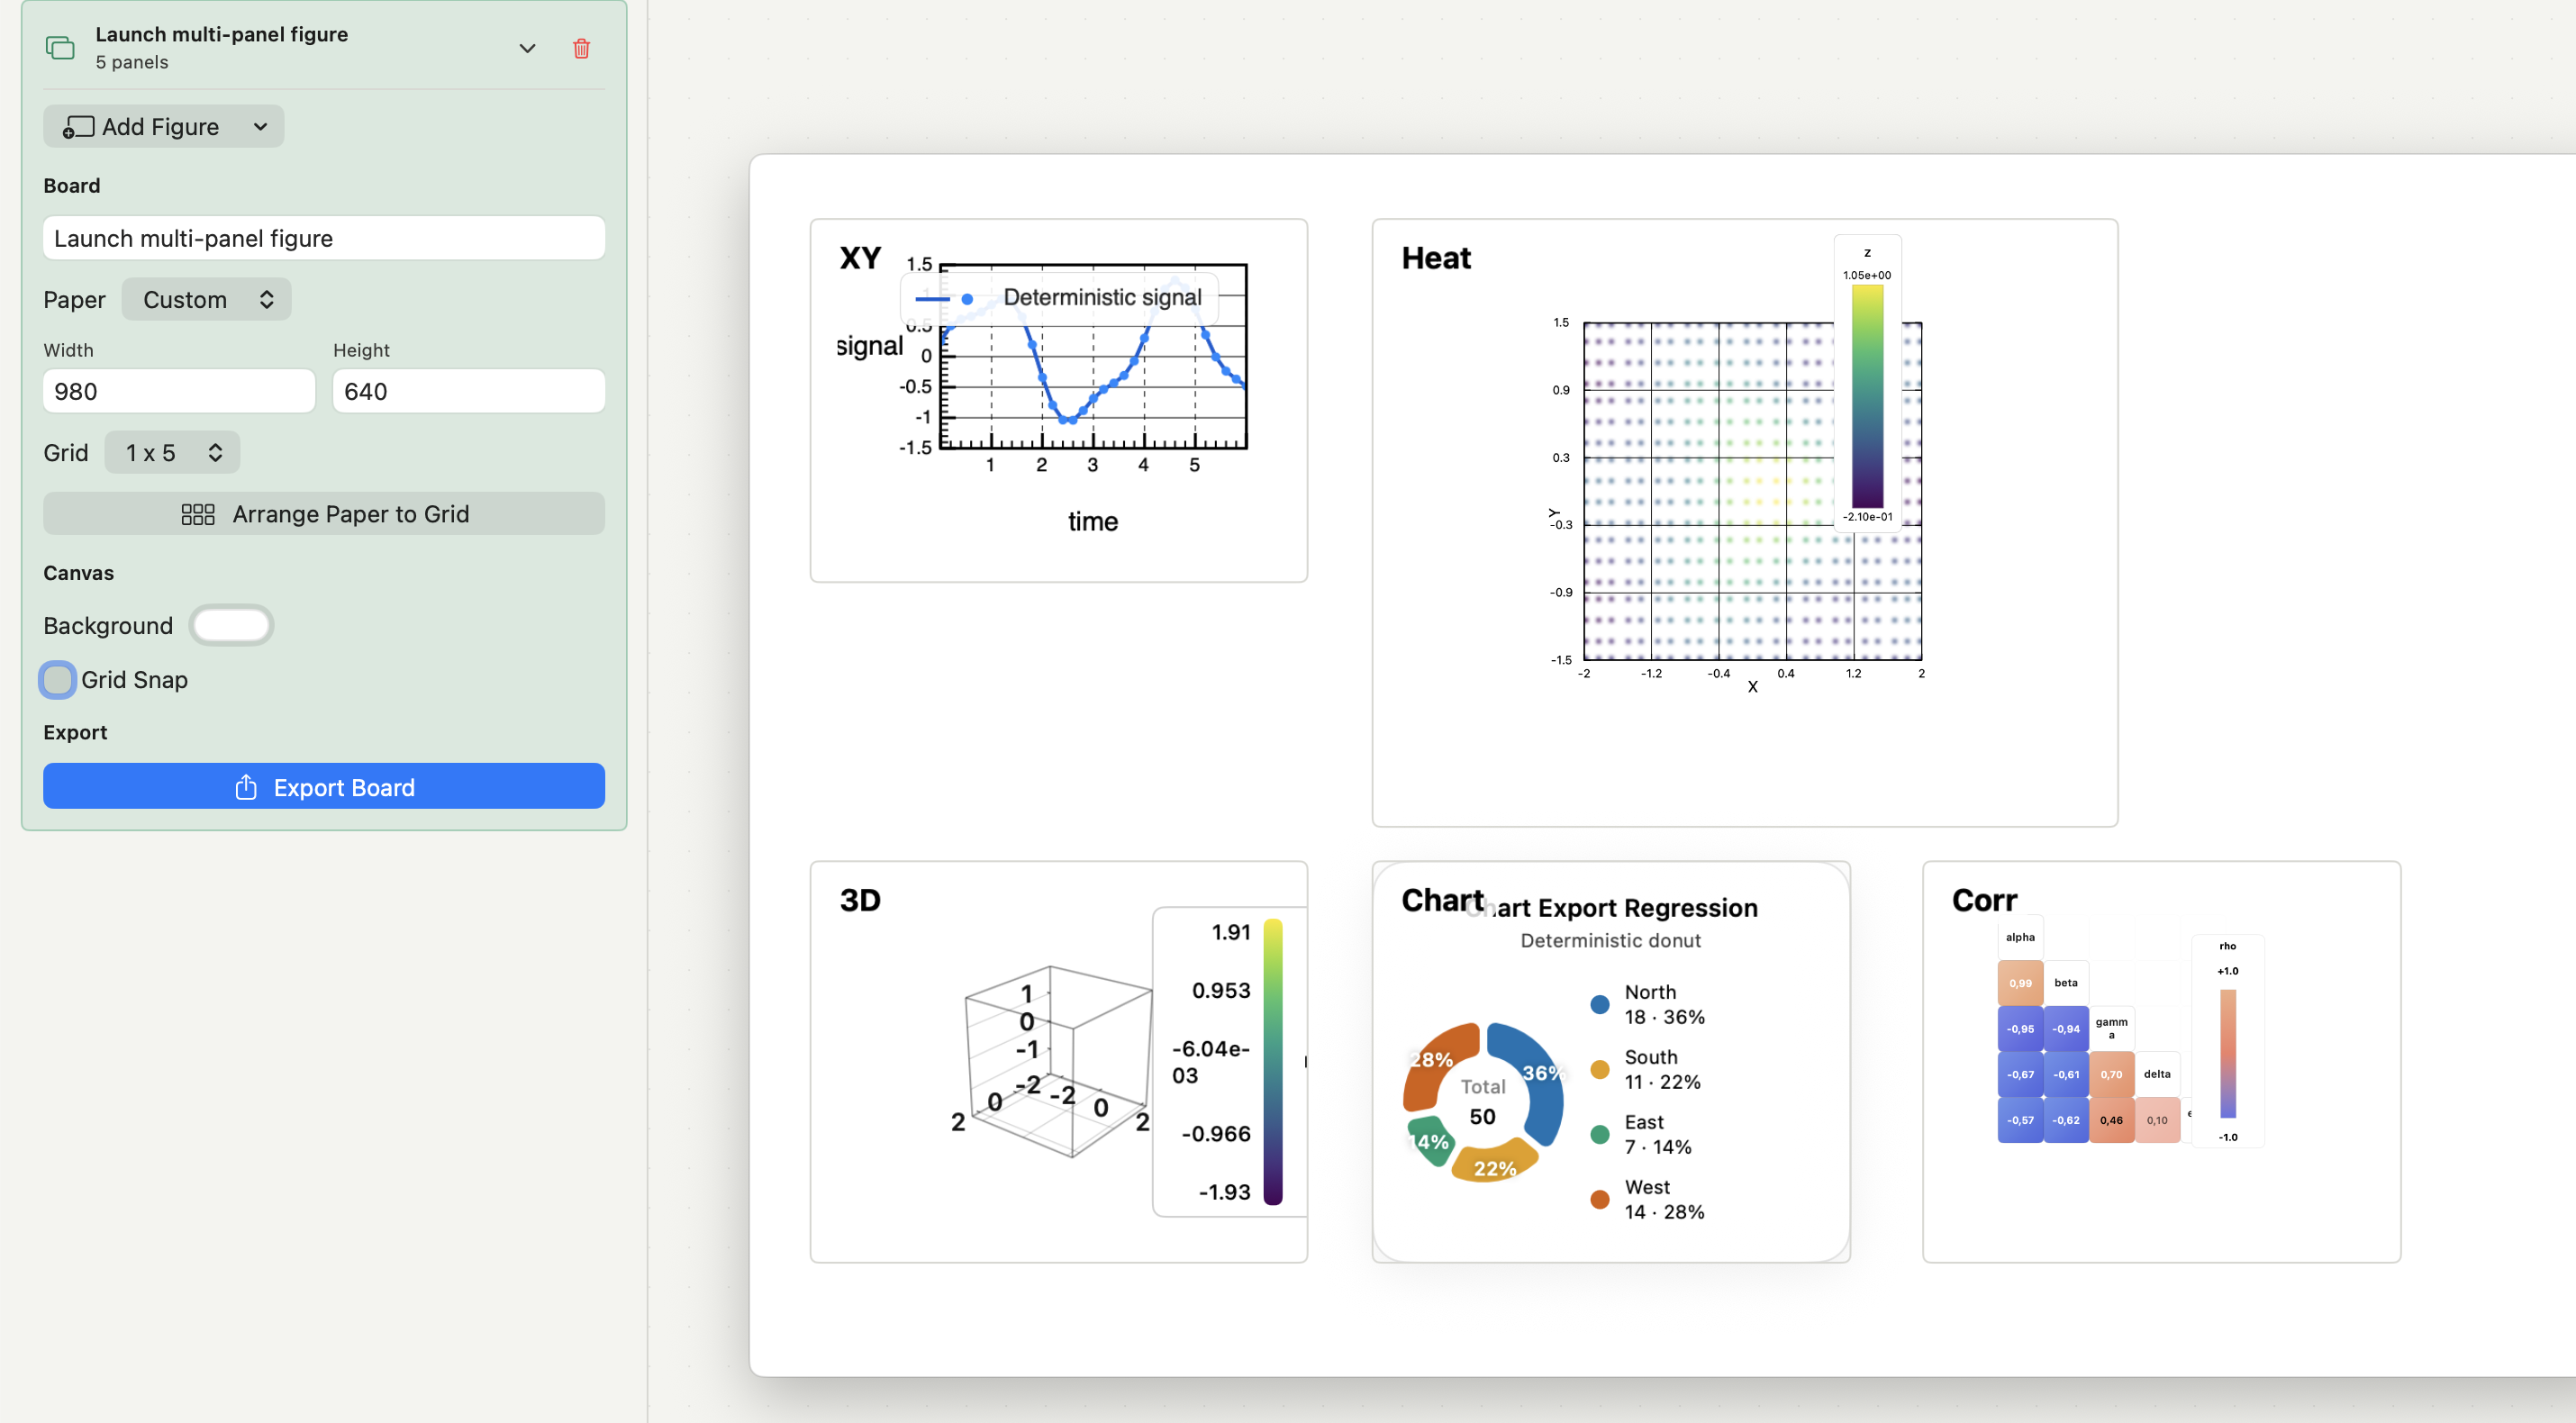
Autoplot is a native Mac application for Apple silicon, macOS 15 or later. It imports CSV, TSV and other delimited text from local files or SFTP, with a parser preview before commit. Named and derived variables feed X&Y plots, histograms, heat maps, 3D plots and correlation matrices. Analysis cards run tested Python implementations locally and write results back as variables. Compose arranges plots on A4, Letter or custom boards, and figures export as PNG, JPEG or vector PDF with embedded fonts at journal sizes and DPI. For anything not built in, the assistant writes Python, runs it on your Mac inside a working folder and keeps the script.
The limits are plain. Autoplot does not run on Windows or Linux. It does not open Igor, Origin, MagicPlot, DataGraph or Jupyter files; it starts from exported tables. It has no unattended one-figure-per-file batch export, and its analysis catalogue is narrower than Origin's, Igor's or a Python environment's. The free plan never expires, and Plus adds heat maps, 3D, correlations, Compose and the cumulative-distribution tools; see the features page and pricing.
Frequently asked questions
| Is there a Mac version of Origin? | No full native version. OriginLab describes Origin as a Windows application and recommends running it on a Mac through virtualisation, such as Parallels Desktop with Windows 11 on ARM on Apple silicon. A free native Origin Viewer can open and export files. |
|---|---|
| Does Igor Pro run on Apple silicon Macs? | Igor Pro 9, the last Mac version, runs through Rosetta 2 because it is compiled for Intel. Igor Pro 10 runs on macOS only inside a Windows virtual environment. |
| What free scientific plotting software runs on a Mac? | Python with Matplotlib and R are free, open and cross-platform. Autoplot has a permanent free plan with X&Y plots, histograms, distributions and power-law fits. |
Sources
Autoplot statements come from the app's documentation for import, plotting, analysis cards, Compose, export, the Reproducible Python trace and the assistant, checked on 9 October 2026, and from the features page. WaveMetrics documents Igor's Mac status on its platform support page and version list. OriginLab covers Mac use in its Mac guidance and system requirements. GraphPad describes Prism on its features page. DataGraph's scope comes from the DataGraph manual. The code options cite the R Project, MATLAB, the Jupyter documentation and Matplotlib installation.