
On this page
DataGraph vs Autoplot at a glance
| Need | DataGraph | Autoplot |
|---|---|---|
| Platform | Mac only, macOS 11.5 or later | Apple silicon Macs only, macOS 15 or later |
| Scope | Manual describes a two-dimensional focus | 2D plots, heat maps and 3D in one project |
| Data model | Linked columns, expressions, commands | Named and derived variables; filtering and splitting through the assistant |
| Nonlinear X/Y fitting | Yes, with weights, bounds, fit ranges and residuals | No general fitter; linear and polynomial trends on X&Y |
| Export | PNG, JPG, PDF, SVG; MP4 movies | PNG, JPEG, vector PDF with embedded fonts; Matplotlib script |
| Opens DataGraph files | Yes | No |
The fitting and data-model rows cut in DataGraph's favour, the scope row in Autoplot's, along with the packaged heavy-tail analysis described below. Which matters more depends on whether the next project is another 2D figure or a different kind of question.
Where DataGraph is the better choice
DataGraph is not a basic chart utility, and moving a working process has a cost. Stay with it when:
- The workflow is 2D and already validated. If a graph, its expressions and its fit have been checked, rebuilding them elsewhere adds work without improving the result.
- The model is a custom nonlinear function of X. DataGraph fits user-defined models with parameter bounds, weighted least squares and fit ranges, and extracts residuals. Autoplot's general-purpose route for that is SciPy code, written by you or by the assistant.
- Columns drive each other. Expression columns that update when the source changes are central to how DataGraph works.
- You export movies. DataGraph exports MP4 animations; Autoplot exports still images and PDFs.
For 3D work, the developer points DataGraph users, in a reply on its App Store listing, to its separate app ImageTank. That is worth checking before you change tools entirely.
Autoplot as a DataGraph alternative: beyond the 2D graph
3D surfaces and scatter plots
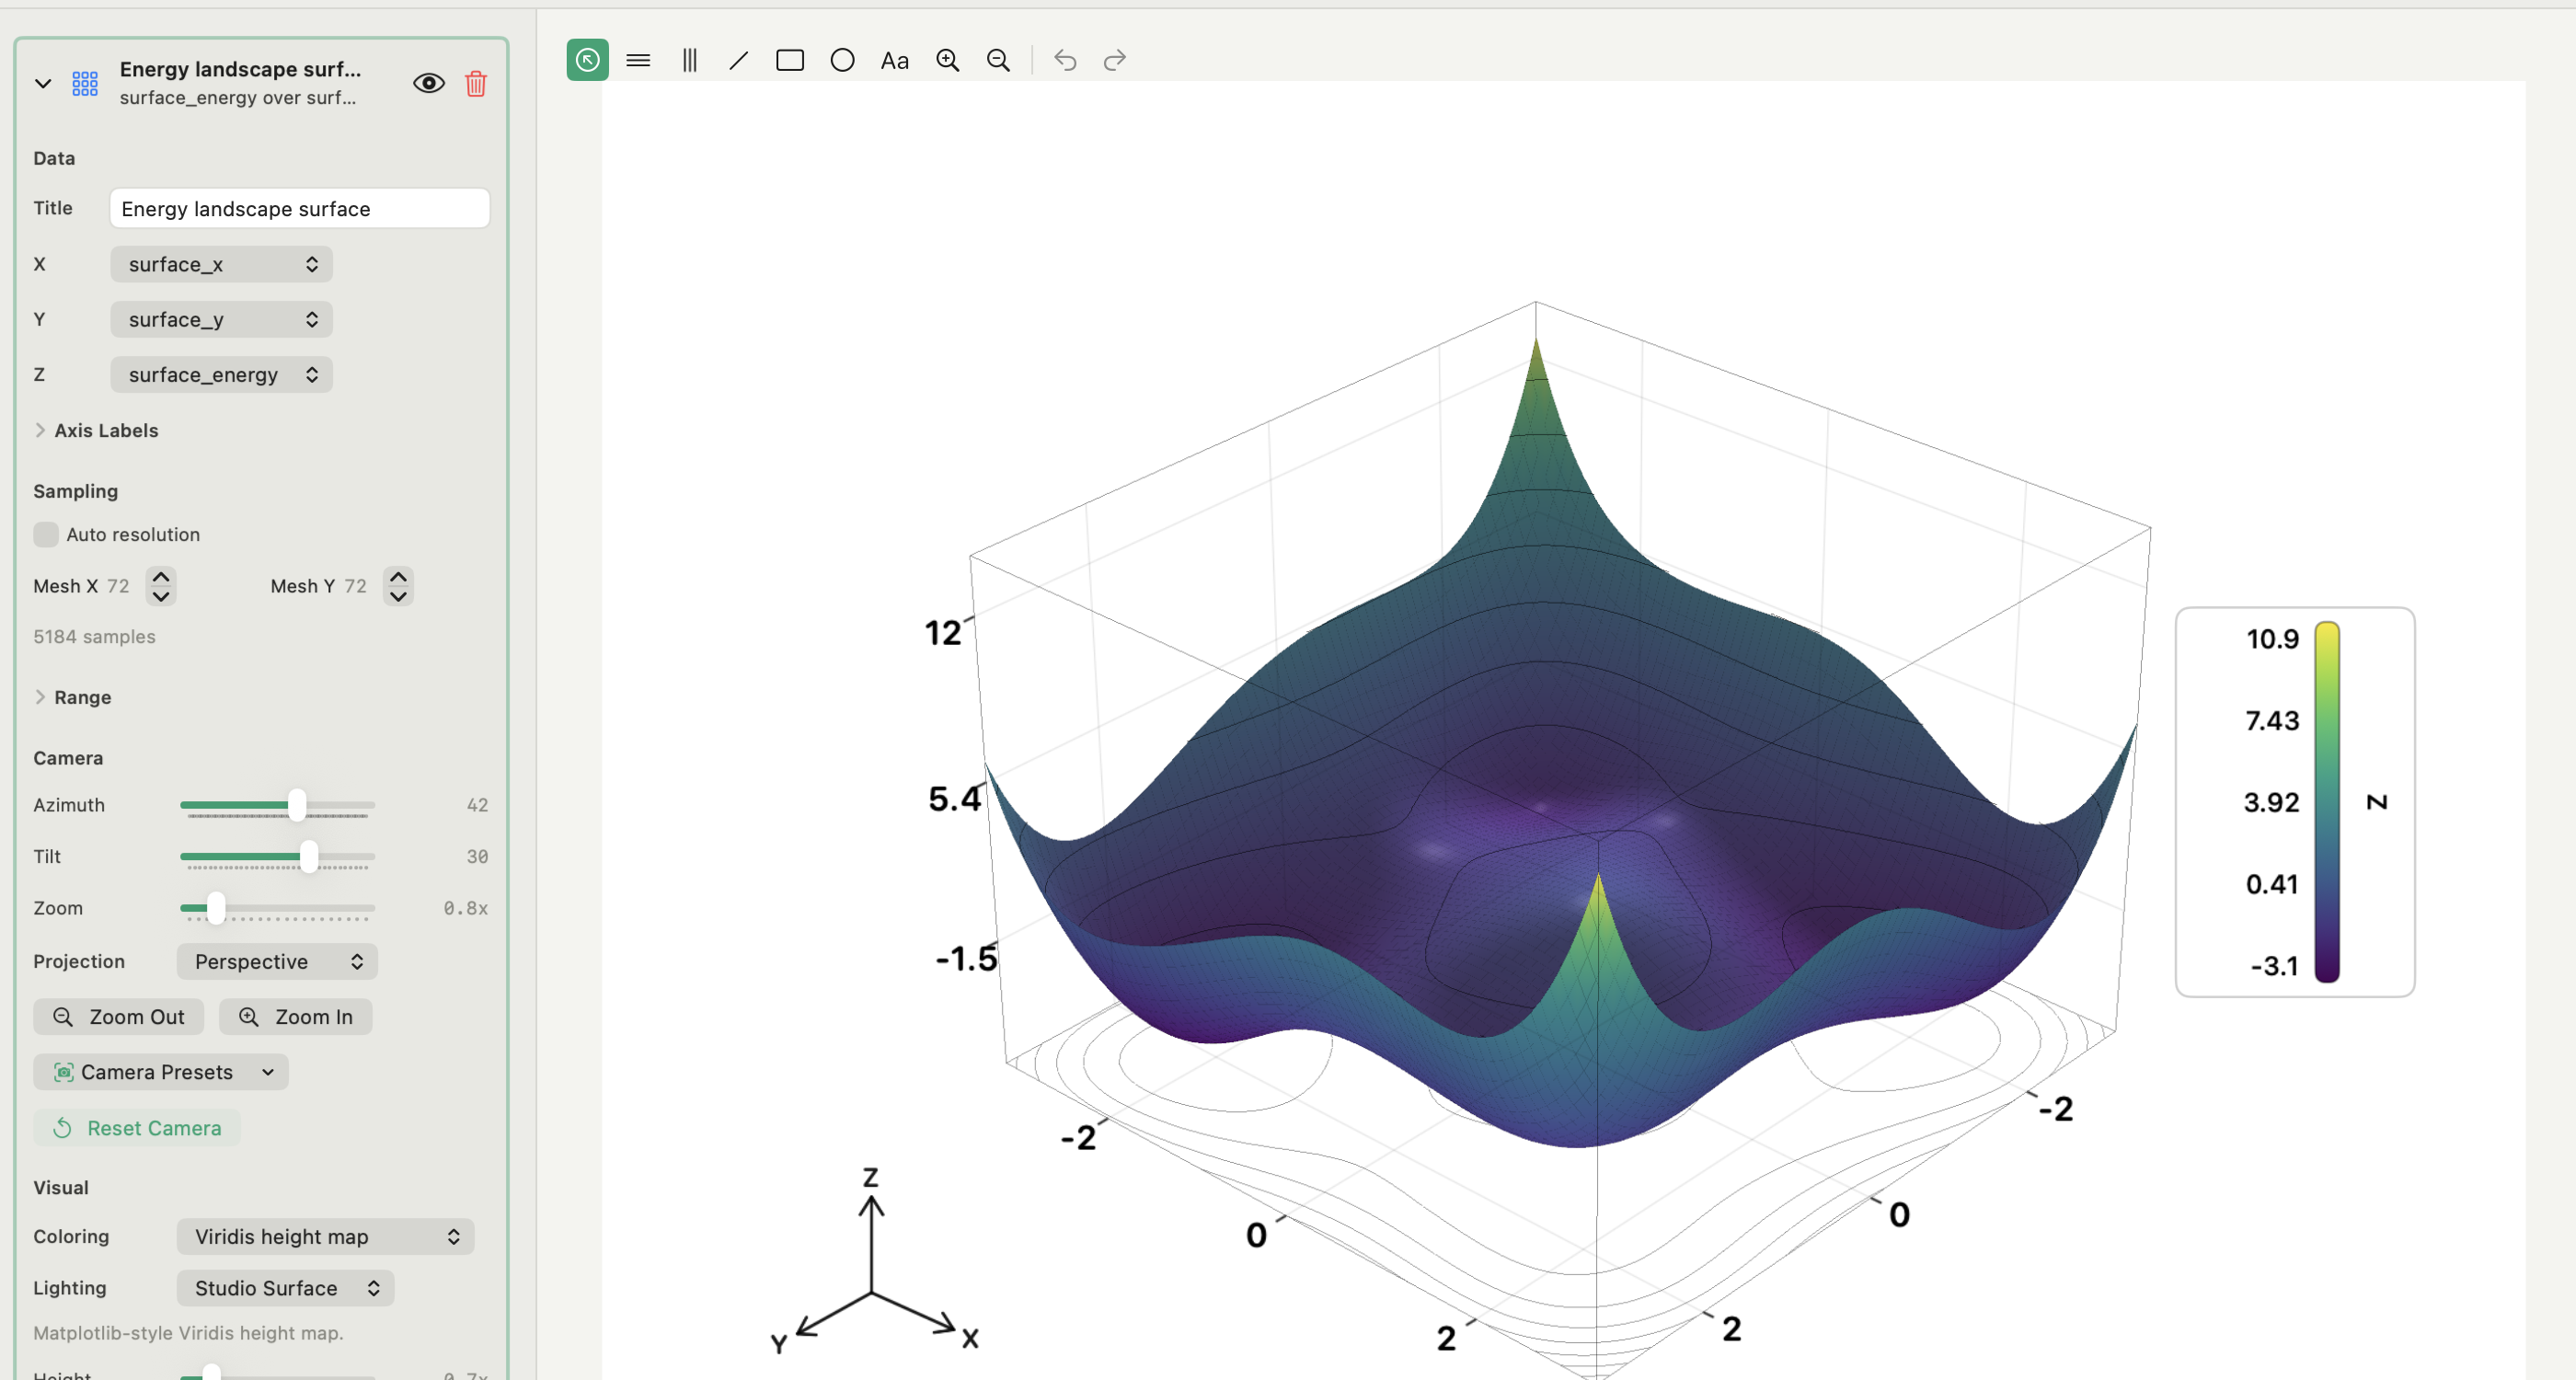
When height is part of the question, a 2D projection hides it. Autoplot renders surfaces, 3D scatter and line trajectories with camera and projection controls, and fits Gaussian or custom surfaces. Max Points decimates dense clouds with a deterministic stride. The 3D scatter plot guide covers when a third axis helps and when it only adds occlusion.
Heavy-tailed distributions as cards
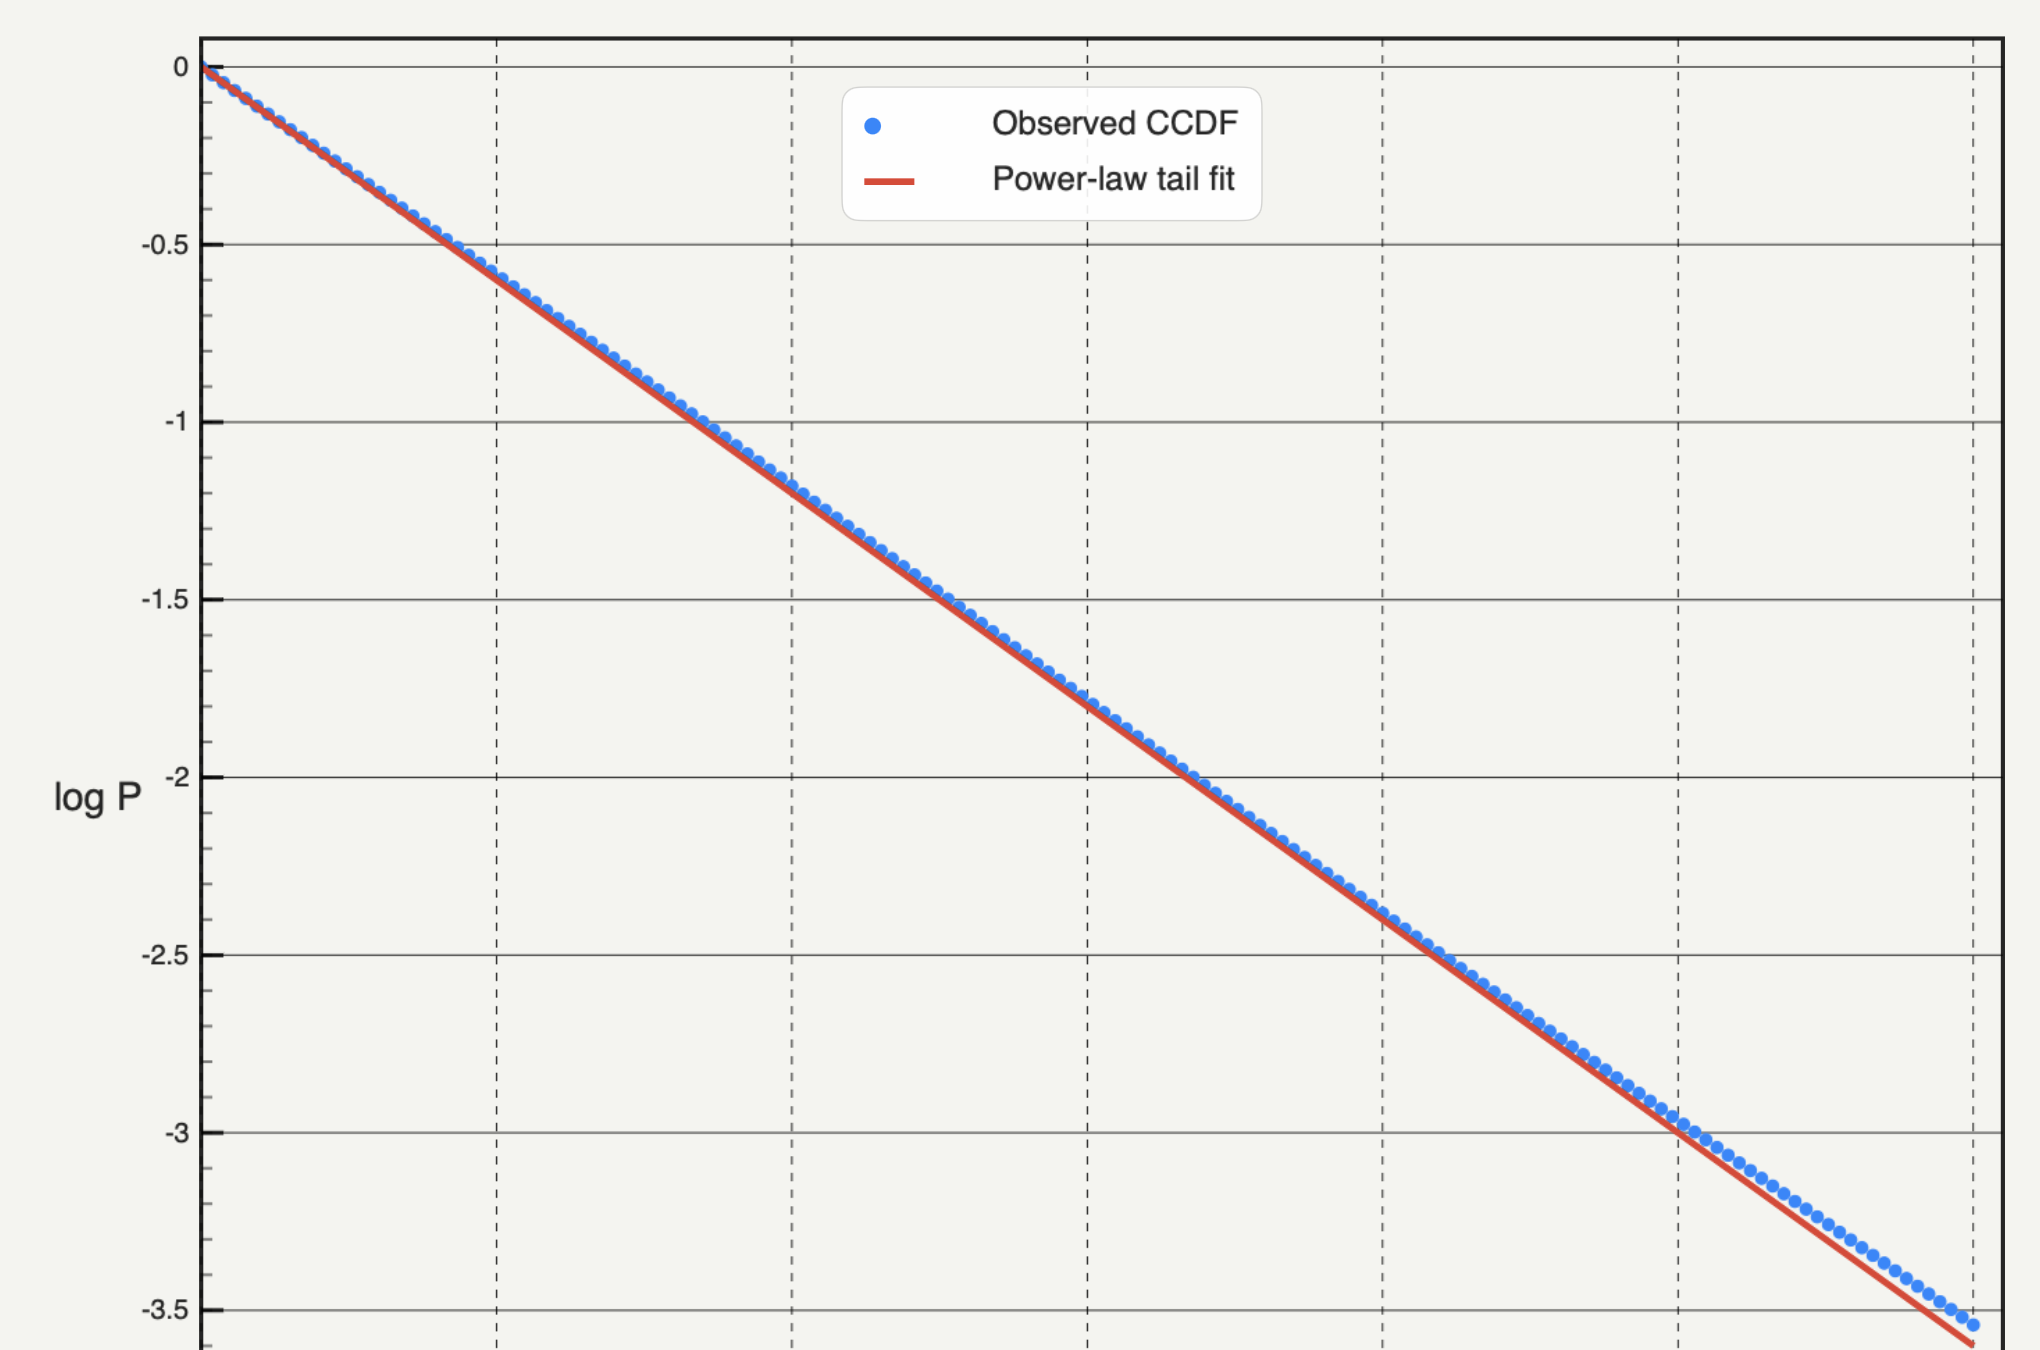
Autoplot packages the methods a heavy-tail analysis needs: log-binned PDFs, a least-squares power-law and truncated power-law fit, an empirical CCDF with a tail fit through the powerlaw library, a Kolmogorov–Smirnov xmin scan, finite-size-scaling collapse and scaling relations of the form x ∼ yᵅ. Each runs locally as a tested Python implementation and writes its result back as variables. How to fit a power law to data explains which method to use.
A route to Python
For anything not built in, the assistant writes Python, runs it on your Mac inside a working folder and keeps the script. You see the code before it runs. A figure can also be exported as an editable Matplotlib script.
Move one DataGraph file to Autoplot
- Keep the original DataGraph file and note the version that opens it.
- Choose a project that needs something new, such as a 3D view or a tail fit. Moving a finished 2D graph proves little.
- Export the source columns from DataGraph as delimited text, keeping the raw columns rather than only computed ones.
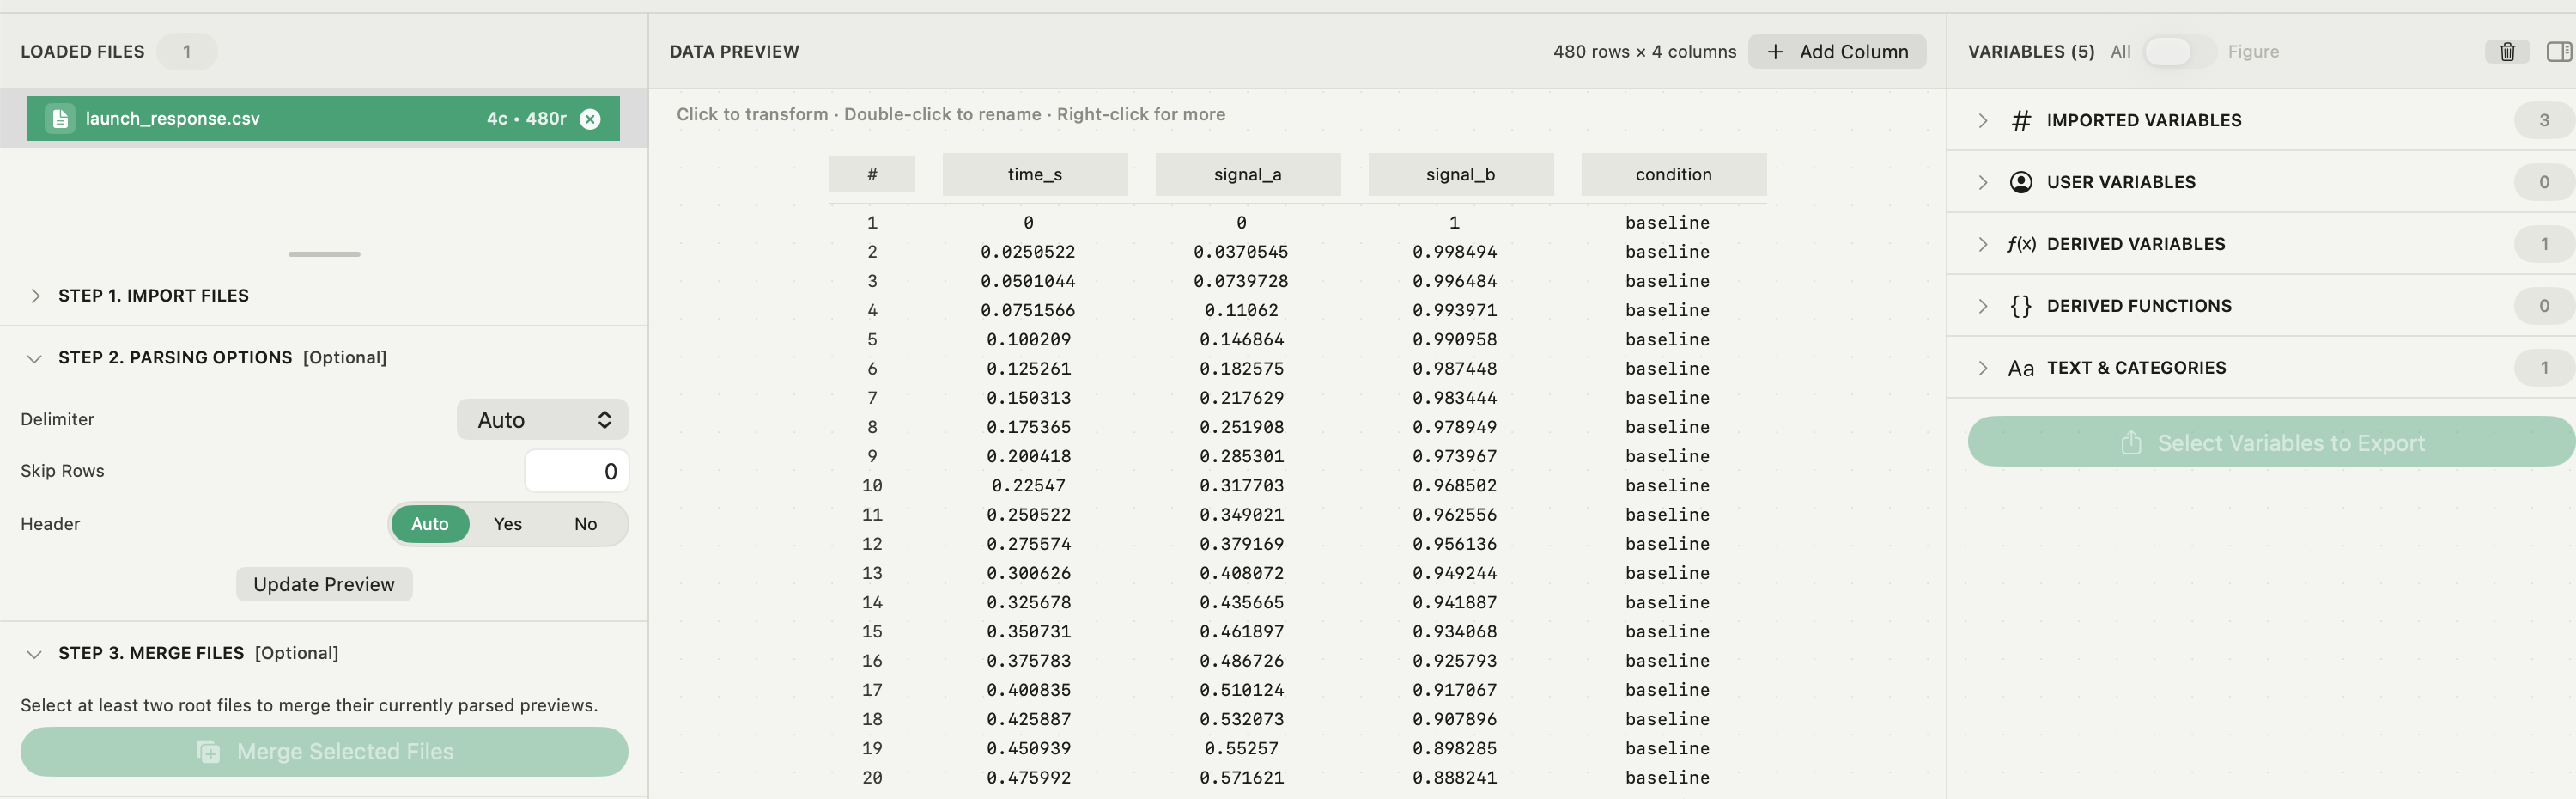
- Import the file into Autoplot and check the parser preview: delimiter, header row, row count and missing values.
- Recreate the derived columns as Autoplot variables and check a few values against DataGraph.
- Run the new analysis, then compare any shared fit by its parameters and residuals, not by the overlay.
- Keep the 2D graphs that already work in DataGraph if nothing is gained by moving them.
For the residual checks, see how to interpret residual plots.
What Autoplot covers, and where it stops
The free plan, which does not expire, covers X&Y plots, histograms with Gaussian-mixture and custom fits, log-binned PDFs and power-law fits. Plus adds heat maps with 2D fits, 3D plots, correlation matrices, Compose, the CCDF card, xmin diagnostics, finite-size-scaling collapse and scaling relations, and is free for the first 30 days. See the features page and pricing.
Autoplot does not open DataGraph files and has no general bounded nonlinear X/Y fitter. It needs an Apple silicon Mac with macOS 15 or later. If those gaps define your work, DataGraph remains the better tool; for a broader comparison, see scientific plotting software for Mac.
Frequently asked questions
| Can Autoplot open DataGraph files? | No. Export the columns you need from DataGraph as delimited text and import that file into Autoplot. |
|---|---|
| Does DataGraph make 3D plots? | Its manual describes a focus on two-dimensional representations, and its developer points 3D work to the separate app ImageTank. Check the current manual for your version. |
Sources
Autoplot statements are based on the app's documentation for variables, X&Y plots, 3D plots and the distribution cards, checked on 9 October 2026, and on the features page. DataGraph's two-dimensional focus and its column, fitting and export features come from the DataGraph manual. Its platform requirement, export formats and the developer's note on ImageTank come from the Mac App Store listing, checked on 9 October 2026.